Ultrasonography OF THE DIGESTIVE SYSTEM
Terminology
Sonographic terms refer to television monitor images produced by returning echoes from tissue, fluid, or gas interfaces that appear as shades of white, gray, or black dots against a black background.
1. Hyperechoic—a tissue that produces echoes of high intensity, when compared with those of
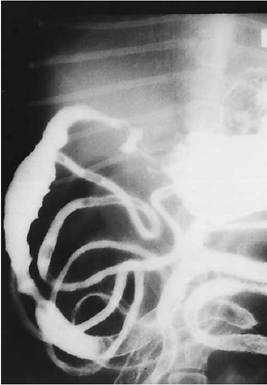
Figure 2-43 Barium contrast study on a dog with pancreatitis. The duodenum is slightly dilated and has an irregular, spastic-appearing mucosal surface. The pylorus is axially displaced.
surrounding tissue, resulting in echoes that are very bright or white
2. Hypoechoic—a tissue that produces low- intensity echoes, when compared with those of surrounding tissue, resulting in echoes that are dark gray
3. Anechoic—an area in which there is no echo formation, resulting in a black image
4. Isoechoic—a tissue that produces echoes that are the same as those of surrounding tissues
5. Complex or heterogeneous echogenicity—a mixture of any of the above echo patterns
Scanning Technique
The following steps are followed in sonography of the digestive system:
1. Shave ventral and lateral abdominal hair.
2. Generously apply water-soluble acoustic coupling gel to the skin surface.[††]
3. Employ 3.5-, 5.0-, 7.5-, and 10-MHz transducers, depending on the depth of penetration necessary. Better resolution is obtained with higher-frequency transducers, but depth penetration is poor. Therefore use the highest-frequency transducer that gives adequate penetration to obtain the best resolution. For example, a 130-lb dog may require a 3.5-MHz transducer to image the dorsal area of the liver, but the pancreas or GI tract in the same dog may be imaged using a 7.5MHz transducer. In most small dogs and cats optimal images of the entire abdomen can be obtained with a 7.5-MHz transducer.
4. Real-time sector or curved linear transducers are preferable to many of the linear array transducers because the smaller scanhead requires a smaller acoustic window. This is particularly useful in intercostal imaging.
5. Obtain sagittal and transverse images routinely. Scan additional planes as necessary, depending on body shape and organ position. To image the liver and stomach, place the transducer caudal to the sternum and last rib and angle cra- nially. The liver, stomach, pancreas, duodenum, and gallbladder can also be imaged through the intercostal spaces or from the right lateral aspect of the patient.
6. Place the patient in dorsal recumbency in a padded V-shaped trough with limbs restrained, or image in lateral recumbency with the top hindleg pulled away from the body. Breed conformation and GI gas affect transducer and patient positioning. Transducer and patient positioning vary, depending on the structure or disease processes imaged. For example, patent ductus venosus, small liver, pancreas, and gallbladder diseases are often best imaged from the right lateral abdomen.
7. To avoid the problem of gastric or intestinal gas shadowing, perform imaging early in the morning (before feeding or significant aerophagia), fill the stomach with water, or perform positional studies to circumvent the gas interference problem. Images are difficult to obtain and interpret if contrast medium is in the stomach or GI tract.
Normal Sonographic Anatomy of the Gastrointestinal Tract
The GI tract is composed of four major histologic layers. Each layer is sonographically displayed as alternating hyperechoic and hypoechoic bands. Five distinct layers may be seen with high- frequency transducers:
1. Lumen and mucosal surface—hyperechoic
2. Mucosa—hypoechoic
3. Submucosa—hyperechoic
4. Muscularis—hypoechoic
5. Serosa—hyperechoic
Often, only three layers are distinguished when the transducer frequency is 5.0 MHz or less: mucosal surface, muscular layer, and serosa.
Real-time scanning of the GI tract allows evaluation of individual wall layers, peristalsis, wall thickness and diameter, lesion location, and appearance of luminal contents. The presence of intraluminal bowel gas does not preclude evaluation of the bowel wall located between the lumen gas and the transducer.
Normal gastric wall thickness is 3 to 5 mm in dogs (Figure 2-44) and 1.1 to 3.6 mm in cats;small intestinal wall thickness in dogs is 3 to 4.5 mm (Figure 2-45) and 1.6 to 2.6 mm in cats; and colon wall thickness is 2.5 to 3 mm in dogs and 1.3 to 2.5 mm in cats.
The proximal duodenum can usually be identified by its continuity with the pylorus. The colon and cecum may be identified by relative location, size, and shape; these often contain considerable gas and/or feces.
The jejunum is randomly arranged. Therefore it is best to perform a survey scan of the jejunum and then isolate and trace individual loops.
Sonographic Diagnosis of
Gastrointestinal Disease
Thickening of the gastric or bowel wall is the most common abnormality detected. This change is considered a nonspecific finding because it can occur in inflammatory and neoplastic bowel wall disease. Bowel wall thickening may be diffuse or focal, and focal thickening may be eccentric or concentric. As a rule the layered appearance of bowel wall tends to be conserved in inflammatory disease and disrupted by neoplasia. Asymmetric, focal change is common with neoplasia. Diffuse,
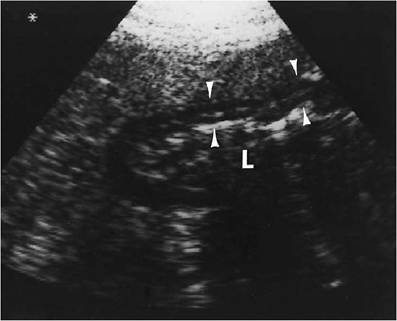
Figure 2-44 Normal scan of a canine stomach. Five distinct layers of stomach wall (between arrowheads) are seen. L, Stomach lumen.
Figure 2-45 Scan of a normal loop of small intestine (arrows). Intestinal lumen and mucosal surface account for the central linear echogenicity. Five distinct layers of intestinal wall (between “+” marks) are seen.
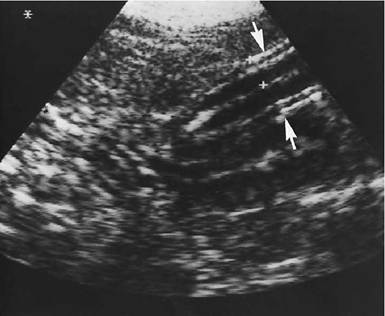
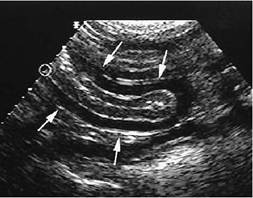
Figure 2-46 Sagittal scan of a small intestinal loop (arrows) in a 7-year-old domestic short hair cat with chronic vomiting.
The wall layers are visible, but the hypoechoic muscle layer is moderately thickened. Inflammatory bowel disease was diagnosed.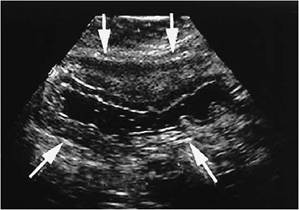
Figure 2-47 Transverse scan of the stomach (arrows) in a 13-year-old tabby cat with a history of anorexia and vomiting. The stomach wall is markedly thickened with maintained visualization of wall layers. Diagnosis was lymphosarcoma.
symmetric thickening is typical of inflammatory bowel disease (Figure 2-46) but can be seen with diffuse neoplasia, such as lymphosarcoma (Figure 2-47). Inflammatory bowel disease (IBD) in cats can appear as normal wall thickness or can show mild to moderate wall thickening, primarily involving the muscle layer. Enlarged mesenteric lymph nodes have been associated with IBD, so biopsy is very important to differentiate IBD from neoplasia. Cats with IBD may have concurrent cholangiohepatitis and pancreatitis. Disruptive, asymmetric changes can occur with hematoma or abscessation. Carcinomas are usually disruptive and concentric. Mucosal irregularity may be present in either neoplastic or inflammatory disease. Masses with a mixed echo pattern are more commonly associated with neoplasia, hematoma, abscess, and granuloma. Motility is usually decreased or absent through the affected area. A biopsy is needed for definitive diagnosis because benign and malignant lesions can appear similar on ultrasound. Some examples of GI tract neoplasia are seen in Figures 2-48, 2-49, 2-50,and 2-51.
Adynamic (nonobstructive, paralytic) ileus is indicated by distended loops of small intestine and variable peristalsis. Dynamic (obstructive) ileus is indicated by distended loops of small intestine larger than in adynamic ileus (Figure 2-52), minimal deformity from adjacent structures, and variable
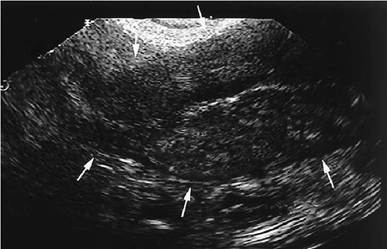
Figure 2-48 Sagittal scan of a small intestinal loop (arrows) in a 10-year-old mixed-breed dog with vomiting and diarrhea.
The intestinal walls are severely thickened with loss of normal wall layers. The central linear hyperechogenicity is the lumen. Diagnosis was adenocarcinoma.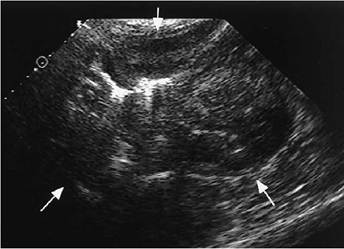
Figure 2-49 Transverse scan of the stomach (arrows) in a 12-year-old Siamese cat with weight loss, vomiting, diarrhea, and decreased appetite.White blood cell count (WBC) was 28,300 with a neutrophilia. The stomach wall is severely thickened and nonhomogeneous with loss of normal wall layers. The hyperechoic focus off center in the stomach is gas in the lumen. Diagnosis was lymphosarcoma.
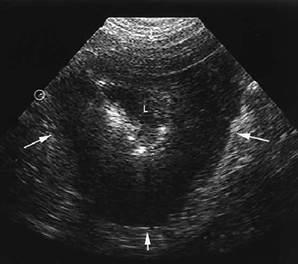
Figure 2-50 Transverse scan of the stomach (arrows) in a 9-year-old shih tzu with anorexia, intermittent vomiting, and weight loss. The stomach wall is markedly thickened and diffusely hypoechoic with loss of wall layers. Diagnosis was adenocarcinoma.
L, Lumen.
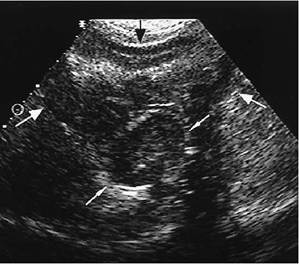
Figure 2-51 Transverse scan of the cardia region of the stomach (large arrows) in a 16-year-old Lhasa apso with hematuria and vomiting once with possible blood in the vomitus. A circumscribed, oval, hypoechoic mass (small arrows) with a hyperechoic margin is seen at the cardia of the stomach. The mucosa appears intact over the mass. Diagnosis was leiomyoma.
Figure 2-52 Scan of a Doberman pinscher puppy presented for vomiting of 2 weeks’ duration. Dilated, transverse segment of small intestine is seen (arrows). Wall thickness is normal, with five layers seen (arrowheads). Lumen (L) is filled with echoic material suspended in fluid. Echogenicity in the lumen was determined to be due to fluid, because movement of the echoic material was noted. Cause of ileus was an intraluminal foreign object.
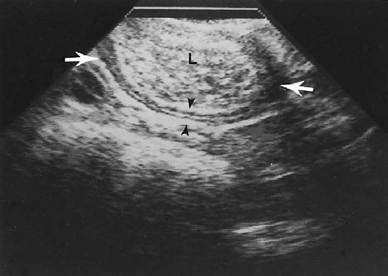
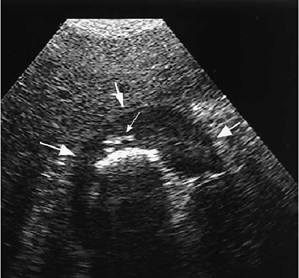
Figure 2-53 Transverse scan of the stomach (large arrows) in a 12-year-old cocker spaniel with a history of vomiting blood and melena.
The stomach wall is markedly thickened with loss of wall layers. The small arrow points to hyperechoic foci within the stomach wall, determined to be gas in small ulcerations. The larger, linear hyperechogenicity is gas in the stomach lumen. Diagnosis was severe ulcerative gastritis.peristalsis. Cause of obstruction—masses, foreign objects, inflammatory disease—can be imaged.
Ulcerative lesions that are small may be difficult to identify (Figure 2-53). Large ulcers have been observed as outpouchings of the GI tract filled with fluid or echogenic material (Figure 2-54). End-on ulcers may appear as a “target” lesion. Color Doppler imaging may show an actively bleeding ulcer. Adjacent free fluid, gas, and/or hyperechoic tissue (Figure 2-55, A and B) may be seen with perforating ulcers.
Intussusception is described as a double- concentric, hypoechoic ring with a hyperechoic center on cross section. The central echogenic area is the mucosa of the intussusceptum, which is surrounded by its hypoechoic muscle layer. The next hyperechoic ring is created by the intussusceptum serosa, mesenteric fat, and intussuscipiens mucosal surface. The outer rings are the hypoechoic mucosa and muscular layers and hyperechoic serosal layer of the intussuscipiens (Figure 2-56, A and B).
Ultrasound appearance of foreign objects is variable, depending on the composition of the object and degree of obstruction (Figures 2-56, B, 2-57, and 2-58). Small bowel dilation is common and should be traced to the area of obstruction. The specific type of foreign object cannot be determined because they all can have a similar appearance of a well-defined, usually hyperechoic focus, with distinct acoustic shadowing deep to the object. Linear foreign body will appear as plicated bowel, and usually a hyperechoic line can be traced through the affected bowel loops. The bowel can be mildly or markedly dilated.
Volvulus is seen as dynamic ileus with layering of U-shaped bowel loops. A cross-sectional image may show C-shaped anechoic masses, due to dilated bowel, with mesentery and mesenteric bowel wall, causing a central hyperechogenicity. At this time volvulus is better diagnosed with radiography.
Normal Sonographic Anatomy of the Liver
Individual liver lobes are difficult to identify, except for the caudate lobe, which is in contact with the right kidney. The quadrate and right
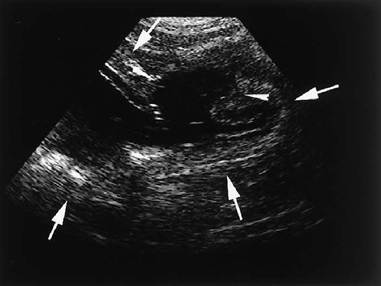
Figure 2-54 Transverse scan of the stomach (large arrows) in a 15-year-old domestic long hair cat with intermittent vomiting of 2 months’ duration. Some episodes included blood. A large ulcer (arrowheads) is seen in the stomach wall. The ulcer is filled with anechoic fluid from the stomach lumen. The wall is mildly thickened with maintained wall layers. Histopathologic analysis was not performed, so the cause of the ulcer was undetermined.
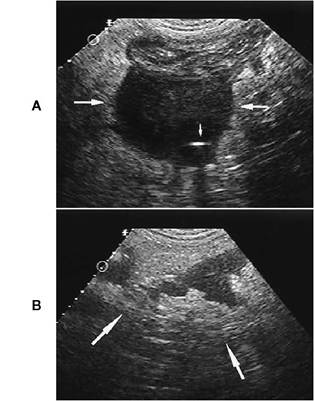
Figure 2-55 A, Oblique scan of the cecum (large arrows) in an 11-year-old mixed-breed dog presented for acute onset of vomiting and diarrhea, shaking, and tender abdomen. There is a well-defined hypoechoic mass arising from the cecum.Within the mass is a small hyperechoic focus (small arrow) that was suspected to be either gas or mineralization. B, Scan of mesentery adjacent to the cecal mass seen in A. There is hypoechoic tissue intermixed with hyperechoic tissue. This appearance is suggestive of hyperechoic reactive mesentery surrounding hypoechoic tissue that might be hemorrhage, necrosis, abscessation, or neoplastic implants. Diagnosis was mast cell tumor of the cecum with localized peritonitis from ulceration.
medial liver lobes lie on either side of the gallbladder. The cranial extent of the liver is delineated by the highly echogenic diaphragm. Caudal margins are partially bordered by the stomach and right kidney (Figure 2-59).
Normal liver parenchyma in the dog has a coarse echogenicity of medium intensity. It is usually more echogenic than renal cortices and less echogenic than spleen. In the cat, hyperechoic portal vessel walls are more prominent than in the dog (Figure 2-60). Normal feline liver echogenicity should be similar to falciform fat; however, increased body fat can cause the liver to be more echogenic than falciform in some cats, without clinical signs of disease.
Portal veins and hepatic veins appear as anechoic tubular, branching structures. Portal vein walls are hyperechoic, whereas hepatic vein walls are usually not visualized. Hepatic biliary ducts are normally not visible.
The main portal vein is ventral and axial to the vena cava. The porta hepatis, which is the site of bifurcation of the portal vein into right and left branches, images as a bright echogenic structure in the midliver. The increased echogenicity is due to fat deposition surrounding the structures in the porta hepatis.
The gallbladder is imaged to the right of midline between the quadrate and the right medial liver lobes. It is anechoic and usually shows distal enhancement. The gallbladder wall may or may not be seen as an echogenic linear structure. Echoic material is commonly found within the lumen of the gallbladder. The size of the gallbladder is variable. Gallbladder shape in dogs and most cats is ovoid, tapering to the neck of the gallblad-
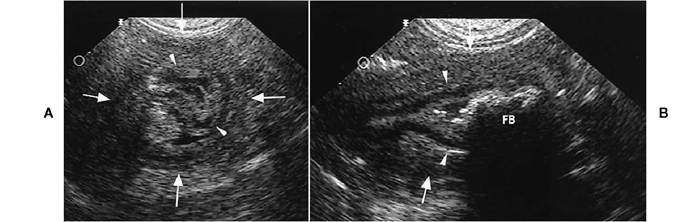
Figure 2-56 A, Transverse scan of small intestine (large arrows) in a 5-year-old Labrador retriever with nonspecific signs of abdominal pain and anorexia. One loop of small intestine (arrowheads) is surrounded by another loop (arrows), consistent with intussusception. B, Same dog as in A. Foreign material (FB), seen within the intussusceptum (arrowheads), surrounded by the intusscipiens (arrows), shows as a slightly irregular hyperechoic linear echogenicity with intense acoustic shadowing deep to the foreign material. Surgery confirmed the intussusception and the presence of cloth in the affected small bowel, which may have caused the intussusception.
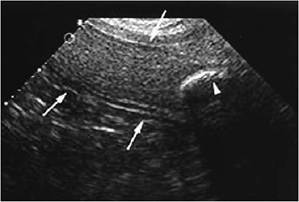
Figure 2-57 Sagittal scan of small intestine (arrows) in a 3-year-old domestic long hair cat with acute onset of lethargy and anorexia. The cat vomited bile 12 times overnight. The abdomen was tender to palpation. The small intestine is markedly dilated and filled with echoic fluid. A hyperechoic, curved focus that has acoustic shadowing is seen within the bowel lumen. Diagnosis was intestinal obstruction from hair, grass, and other foreign material.
der. Some cats may have bilobed gallbladders, but these are not considered clinically significant. The gallbladder neck is caudal to the body and connects with the cystic duct. Hepatic ducts empty into the cystic duct, at which point it becomes the common bile duct. Intrahepatic ducts are not normally imaged.
The common bile duct is ventral to the portal vein. It is not usually seen in normal dogs but may be imaged in some cats. The common bile duct may measure up to 4 mm in normal cats. Because of its small size, it is difficult to visualize with low- frequency transducers.
Assessment of liver size is subjective. In most dogs the caudal ventral liver margin should be at or just caudal to the xiphoid. Body conformation will affect the normal position; for example, deep-chested breeds can have normal liver size, yet the liver can be imaged only from an intercostal location. Any intrathoracic process that results in the diaphragm and liver being caudally displaced can cause the liver to appear enlarged. Assessment of liver size is more accurate on radiographs than with ultrasound.
Sonographic Diagnosis of Liver Disease
Hepatic Parenchymal Disease
Ultrasound is an excellent way to evaluate liver parenchyma. It is particularly useful in differentiating focal from diffuse disease, differentiating cystic from solid masses, and identifying the presence and cause of biliary obstruction. Although ultrasound is sensitive in showing architectural parenchymal changes, it is not specific as to the cause of these changes. Therefore, an abnormality is seen, but the final diagnosis requires a liver biopsy. Multiple samples should be obtained because concurrent disease processes may be present in the liver; for example, lipidosis may be present along with cholangiohepatitis or neoplasia. Aspirates can be obtained but may not accurately reflect all changes occurring in the liver. Diffuse hepatic disease can exist without altering the normal sonographic appearance of the liver.
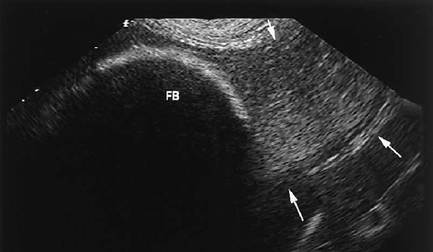
Figure 2-58 Scan of the stomach (arrows) in a 9-year-old Labrador retriever with a history of anorexia and lethargy. A large, curved, faintly echogenic structure with acoustic shadowing (FB) is seen within the stomach lumen.
Surgery discovered a portion of a ball in the stomach.
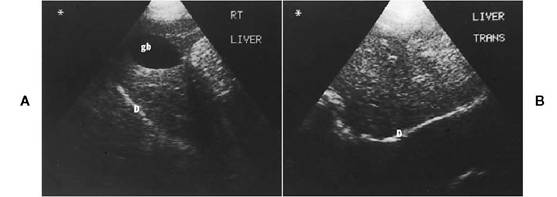
Figure 2-59 Sagittal (A) and transverse (B) scans of a normal canine liver. D, Diaphragm; gb, gallbladder.
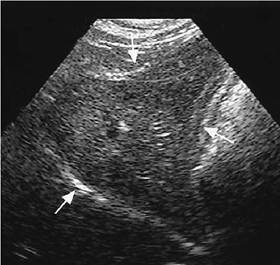
Figure 2-60 Sagittal scan of a normal feline liver (arrows). The liver is homogeneous with prominent portal vessel wall and is slightly hypoechoic to falciform fat.
Indications for hepatic ultrasound include the following:
1. Elevated liver enzymes—Ultrasound images often show focal or diffuse hepatic disease not visible on radiographs.
2. Free abdominal fluid—Sonography can help differentiate among neoplastic masses, diffuse hepatic disease such as cirrhosis, and hepatic venous congestion.
3. To determine extent of hepatic neoplasia— Sonography can determine if the tumor is confined to one or multiple liver lobes or if there is extension to lymph nodes or other abdominal organs. This provides information that is used to determine if the patient has a lesion that can be surgically excised.
4. To differentiate obstructive from nonobstructive icterus—Dilation of the common bile duct, cystic duct, or hepatic ducts is readily visualized with ultrasound. Causes of the obstruction (e.g., calculi, masses, pancreatitis) can be imaged.
FIGURE 2-61 Sagittal scan of the liver (arrows) in an 8-year- old mixed-breed dog with a history of abdominal distension and anorexia for 2 days. Liver enzyme levels were markedly elevated, total bilirubin level was 1.8, and WBC was 19,000. The liver margins are irregular and nodular. Liver echogenicity is nonhomogeneous with patchy hyperechoic and hypoechoic regions and hypoechoic nodules. Anechoic free abdominal fluid surrounds the liver. Diagnosis was hepatic cirrhosis with nodular hyperplasia.
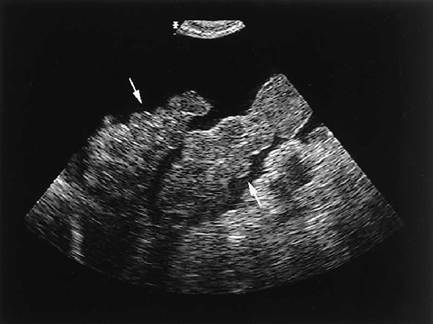
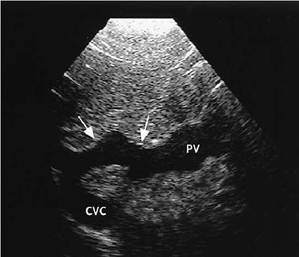
Figure 2-62 Sagittal scan of the liver in a 4-year-old springer spaniel mix with vomiting, diarrhea, weight loss, and decreased appetite. Liver enzyme levels were mildly elevated. The liver imaged very small, and an intrahepatic shunt (arrows) was discovered connecting the portal vein (PV) to the caudal vena cava (CVC).
5. To differentiate cystic from solid masses— Benign cysts are anechoic, have thin, defined walls, and show increased echogenicity deep to the cyst.
6. To identify gallbladder calculi, cholecystitis, or ruptured gallbladder.
7. To image congenital or acquired portocaval or portosystemic shunts—This requires meticulous inspection of the abdomen using various scanning planes.
8. Biopsy—Ultrasound-guided hepatic biopsy allows precise direction of the biopsy needle to the area of abnormal tissue and avoidance of large vessels, the gallbladder, and the GI tract.
Diffuse Liver Disease
The liver may appear sonographically normal despite the presence of liver disease. However, subjective assessment of liver size, shape, and echogenicity is helpful in determining the presence of a diffuse disorder.
Liver Size
Small livers are detected with chronic hepatitis, cirrhosis (Figure 2-61), liver shunts (Figure 2-62), liver atrophy, and diaphragmatic hernias. Enlarged livers can be seen with metabolic disease, neoplasia, granulomatous disease, hepatobiliary inflammation, feline lipidosis, venous congestion, cystic disease, abscesses, nodular hyperplasia, and biliary disease.
Liver Shape
Irregular liver shape or margin is frequently associated with cirrhosis, hyperplasia, neoplasia, abscesses, and granulomas. Sometimes it is necessary to use a 7.5-mHz or higher transducer, even on a large dog, to image the ventral liver margin to detect subtle margin irregularity.
Liver Echogenicity
In diffuse disease, changes in echogenicity include homogeneously hypoechoic, homogeneously hyperechoic, and patchy hypoechoic and hyper- echoic zones or nodules. One lobe, multiple lobes, or segments of lobes may be affected.
Hypoechogenicity of the liver is a subjective assessment, but comparing liver with known surrounding normal tissues is helpful. Renal cortex and falciform fat are usually less echogenic than is
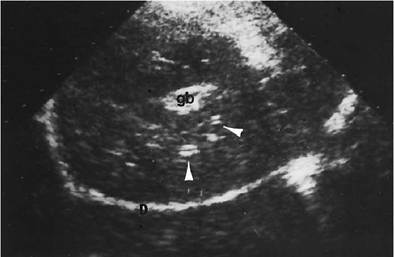
Figure 2-63 Liver scan of an Irish wolfhound presented for depression and icterus with elevated bilirubin and alkaline phosphatase. There is a very thick hyperechoic gallbladder wall. The gallbladder (gb) is not distended. The entire liver is hypoechoic. Multiple anechoic tubular structures with defined hyperechoic walls are seen throughout the liver (arrowheads). These most likely represent portal veins that are better visualized owing to surrounding hypoechoic liver. Sonographic changes suggest cholecystitis and cholangiohepatitis. Surgery showed a diffusely enlarged liver filled with dark, inspissated bile. Diagnosis was cholangiohepatitis with severe canalicular bile stasis, consistent with a toxic insult. D, Diaphragm.
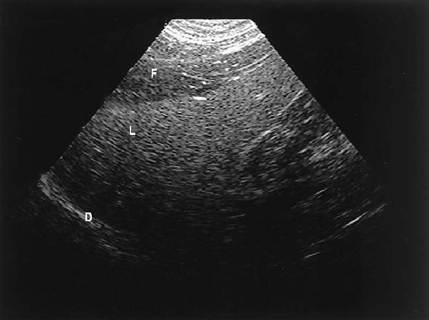
Figure 2-64 Sagittal scan of the liver in an 8-year-old domestic medium hair cat with some vomiting and diarrhea, anorexia for 1 week, and icterus. Liver enzyme levels were elevated, total bilirubin level was 12.3, and WBC was normal. The liver (L) is hyperechoic with loss of visualization of portal vessel walls and sound beam attenuation in the deeper portions of the liver. Falciform fat (F) appears hypoechoic to liver echogencity. Diagnosis was hepatic lipidosis. D, Diaphragm.
liver in dogs.Vessel walls appear more echogenic and more numerous, and gallbladder wall may be more prominent or thickened. Hypoechoic livers have been associated with diseases that accumulate fluid in hepatocytes, such as acute hepatitis, cholangiohepatitis (Figure 2-63), hepatic venous congestion (will also see dilated hepatic veins and caudal vena cava), and hepatic necrosis. Lymphosarcoma may also appear diffusely hypoechoic. These disorders are the more common causes for hypoechoic livers, but other processes are possible. Inflammation or infection of other organs, such as pancreatitis, prostatitis, or gastroenteritis, may also cause the liver to appear diffusely hypoechoic, possibly secondary to septicemia.
Hyperechogenicity of the liver is subjectively determined by comparison with known surrounding normal tissues and decreased visualization of hepatic vasculature. Some infiltrative processes, particularly feline lipidosis, will cause attenuation of the sound beam in the deeper parts of the liver (Figure 2-64). Disease processes that are associated with hyperechoic liver include lipidosis, steroid hepatopathy (due to increased glycogen storage), Cholangiohepatitis, chronic hepatitis, cirrhosis, diabetes mellitus, and lymphosarcoma. This list is not all-inclusive, and other processes are possible.
Patchy liver echo patterns with mixed hypo- echoic, hyperechoic, and isoechoic regions are a nonspecific change that suggests a diffuse disorder. Some of the areas may show or mimic nodularity. The changes may reflect a mixture of normal liver, inflammation, fatty infiltration, hepatopathy, hepatic necrosis, hyperplasia, neoplasia, and other disease processes (Figure 2-65). Histologic diagnosis is necessary for definitive diagnosis. Hepatocutaneous syndrome has a fairly characteristic diffuse echopattern of hyperechoic, “lacey” strands that surround ovoid to spherical hypoechoic zones (Figure 2-66).
Focal Liver Disease
Ultrasound is useful to describe the appearance of focal lesions in the liver. The size, shape, number, margin definition, and echogenicity are easily characterized, except for very small masses, such as seen with carcinomatosis, which may not be detected. Focal lesions in the liver can appear hypoechoic, hyperechoic, anechoic, or isoechoic or have a combination of any of these echogenicities. Ultrasound can help determine the number and location of lesions and association with structures such as the portal vein, caudal vena cava, and gallbladder, which may affect the decision on whether to attempt surgical excision.
Anechoic focal lesions can be caused by true cysts, biliary pseudocysts, parasitic cysts, enlarged end-on bile ducts, abscesses, and arteriovenous fistulas (Figure 2-67). Hyperechoic, hypoechoic, and mixed echoic masses can be caused by metastatic or primary neoplasia, lymphosarcoma, abscesses, granulomas, nodular hyperplasia, biliary cystadenomas, and hematomas (Figures 2-68 to 2-75). Correlating history and clinical findings is helpful in forming a differential diagnosis, but biopsy is needed for definitive diagnosis.
Gallbladder Disease
1. Extrahepatic biliary obstruction (experimental) results in the following:
a. Rapid gallbladder distention
b. Bile duct enlargement by 48 hours
c. Extrahepatic duct dilation by 3 days
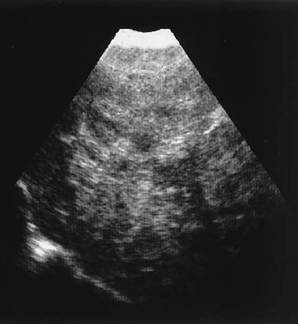
Figure 2-65 Sagittal scan of the liver in an 8-year- old German shepherd-mix that was on long-term phenobarbital for seizures. Liver enzyme levels were elevated. Ultrasound shows a nonhomogeneous liver echogenicity with patchy hyperechoic zones throughout the liver. Diagnosis was moderate hepatitis with nodular hyperplasia and vacuolar hepatopathy, possibly secondary to chronic phenobarbital administration.
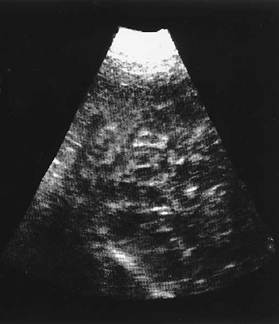
Figure 2-66 Sagittal scan of the liver in an 11-year- old Skye terrier with a 3- to 4-week history of severely inflamed, thickened, painful footpads on all four feet.
Liver enzyme levels were elevated. The liver is diffusely nonhomogeneous with numerous hypoechoic nodules intermixed with hyperechoic strands. Overall liver texture appears coarse and has been described as a “Swiss cheese-like” or “honeycomb” appearance. Diagnosis was hepatocutaneous syndrome.
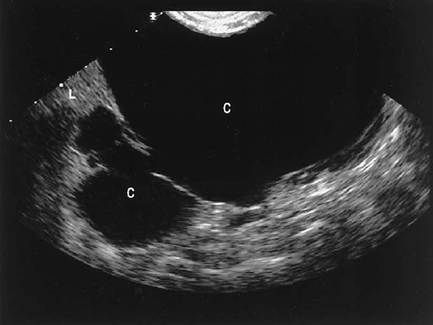
Figure 2-67 Transverse scan of the liver in a 10-year-old domestic short hair cat presented for routine vaccinations. A mass was palpated in the cranial abdomen. Ultrasound shows a large, thin-walled, anechoic structure (C) with a small connecting anechoic structure (C). A small portion of liver (L) is seen. Diagnosis was probable congenital hepatic cyst.
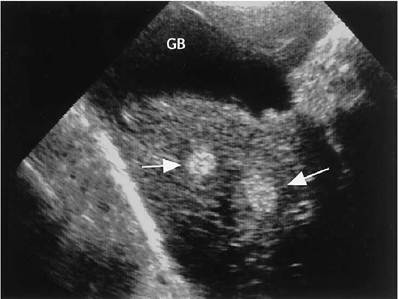
Figure 2-68 Sagittal scan of the liver in a 14-year-old German shepherd with multiple splenic and hepatic masses. Hyperechoic nodules (arrows) are seen in the liver, near the gallbladder (GB). Diagnosis was metastatic hemangiosarcoma.
d. Intrahepatic duct dilation by 7 days (Figure 2-76).
Pathologic biliary obstruction is usually mechanical secondary to liver, biliary, pancreatic, or duodenal inflammatory or neoplastic disease. These diseases can be sonographically visualized. Obstruction from biliary calculi is rare but is easily imaged. Mild intrahepatic duct dilation is seen on an ultrasound image as two parallel, anechoic channels in close proximity to each other. One channel is a portal vessel, and the other is a bile duct. The duct may have a tortuous appearance. Large intrahepatic duct dilations can be tubular or may look cystic, due to cross-sectioning of the duct.
2. Thickened gallbladder wall
a. Diffusely hyperechoic wall, with or without shadowing, is often seen with cholecystitis, calcification or fibrosis, acute hepatitis, and cholangiohepatitis.
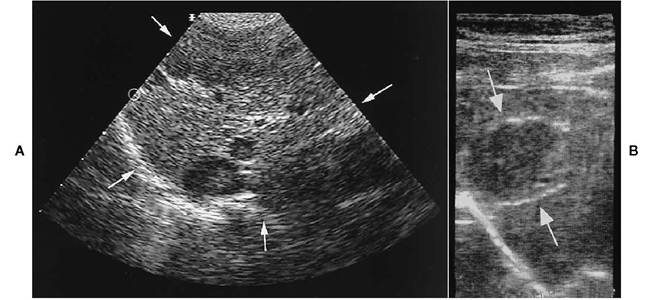
Figure 2-69 A, Transverse scan of the liver (arrows) in a 13-year-old springer spaniel with a history of weight loss and anorexia for 2 days. Focal, hypoechoic masses are seen within the liver. A large, mixed echoic mass was seen on another scan of a different area of liver. Diagnosis was metastatic hepatocellular carcinoma. B, Sagittal scan of the liver in an 11-year-old domestic short hair cat. A circumscribed, hypoechoic mass (arrows) is apparent. Diagnosis was metastasis from a cecal adenocarcinoma.
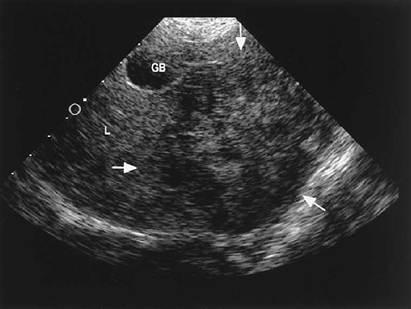
Figure 2-70 Transverse scan of the liver (L) in a 13-year-old golden retriever with vague signs of lethargy and anorexia. A mixed hypoechoic and patchy anechoic mass (arrows) is seen in the midliver and left liver. Margins on the mass are not sharply defined. Diagnosis was hepatocellular carcinoma.
b. Focal hyperechoic areas, with or without shadowing, are commonly associated with mineralization, fibrosis, or calculi.
c. “Halo” or double rim around gallbladder wall usually indicates wall edema or inflammation but can be seen with free abdominal fluid. Abdominal imaging should help differentiate wall edema from abdominal fluid (Figure 2-77).
d. Generalized wall thickening, with or without irregular mucosa, is consistent with inflammation (Figure 2-78). Nondistended gallbladder walls may appear slightly thickened in normal patients.
3. Gallbladder and bile duct masses
a. Calculi/concretions are hyperechoic and usually show shadowing deep to the calculus (Figure 2-79).
b. Neoplasia is variable with circumscribed or ill-defined echogenicity in area of gallbladder or bile duct, with or without biliary obstruction (Figure 2-80).
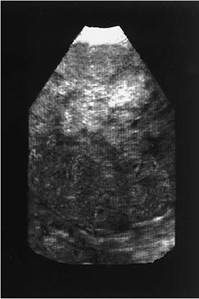
Figure 2-71 Scan of a large liver mass in a 12-year- old German Shepherd-mix with normal liver enzyme levels. The mass constitutes most of this image, with no normal liver parenchyma visible. It has a mixed hyperechoic and hypoechoic echo pattern and poorly defined margins. Diagnosis was hepatocellular carcinoma.
c. Polypoid, echoic masses in gallbladder may be due to glandular cystic hypertrophy.
d. Biliary sludge may mimic mass lesions. If necessary, positional (gravitational) sonographic studies should be performed to further characterize gallbladder echoes.
Normal Sonographic Anatomy of the Pancreas
The pancreas can be imaged in normal dogs, cats, and most ferrets.
The right limb of the pancreas is found dorso- medial to the descending duodenum. The presence of the pancreaticoduodenal vein within the pancreas facilitates pancreatic identification (Figure 2-81). The left limb is more difficult to image in the dog because of its close relationship with the stomach and transverse colon and overlying gas; however, with perseverance it can often be located. The left limb is usually visualized in the cat between the transverse colon and the stomach (Figure 2-82).
Gross adjacent anatomic landmarks are described as follows: The right lobe is found dorsal or dorsomedial to the duodenum, cra- nioventral to the right kidney, ventrolateral to the portal vein, and between the ninth and tenth intercostal spaces to the level of the fourth lumbar vertebra. The left lobe is found dorsocaudal to the stomach, dorsocranial to the transverse colon, ventrolateral to the portal vein, ventral to the aorta and caudal vena cava, and dorsomedial to the spleen.
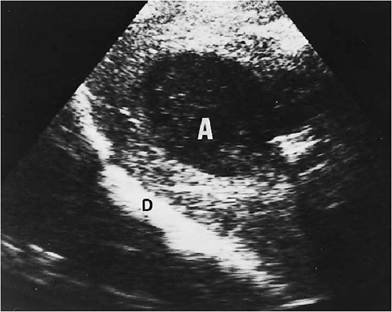
Figure 2-72 Sagittal liver scan of a Doberman pinscher with a history of gastric dilatation-volvulus and subsequent gastric rupture. A large, well-circumscribed hypoechoic mass (A) is seen in the midliver. A liver abscess was suspected and was confirmed at surgery. D, Diaphragm.
Figure 2-73 A, Sagittal scan of the liver in a 10-year-old Gordon setter with a history of lethargy and an elevated temperature of 105.6° F. The WBC was normal, but liver enzyme levels were mildly elevated. There is a large mass in the liver (arrows) that has mixed echogenicity with a large central anechoic region. Purulent material was drained from the mass. Culture indicated a hepatic abscess due to hemolytic Staphylococcus. Diagnosis based on a biopsy specimen of the mass was also chronic hepatic abscess. B, One-month repeat ultrasound of the area in A after antibiotic therapy. The mass is still visible but appears smaller and more homogeneous with no evidence of fluid within the mass.
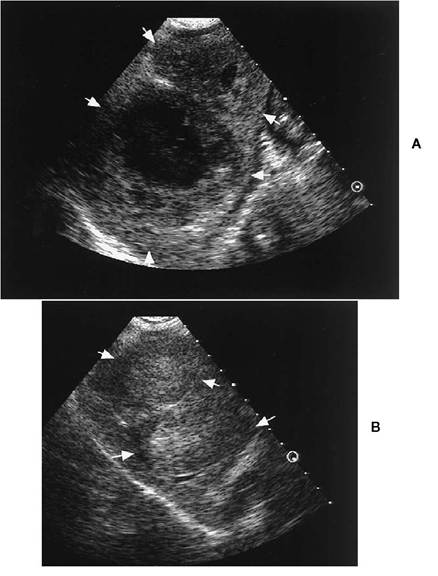
Figure 2-74 Transverse scan of the liver in a 14-year-old Persian cat with hematuria. The hyperechoic liver mass contains tiny cysts. It has a defined but irregular margin. Diagnosis was biliary cystadenoma. Cystadenomas have been reported to have variable ultrasound patterns that usually include hyperechogenicity with variable-sized cyst or cysts. They can be multifocal or singular. GB, Gallbladder.
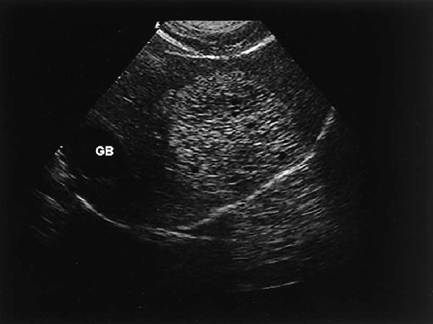
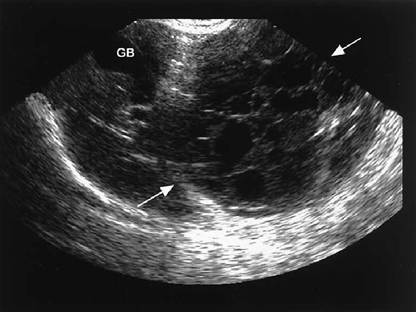
FIGURE 2-75 Oblique scan of the liver in a 14-year-old domestic short hair cat with vomiting and lethargy. Liver enzyme levels were mildly elevated; values for BUN, creatinine, and phosphorus were also elevated. The scan shows a very large, multicystic mass (arrows). Biopsy of the mass was not performed, but sonographic differential diagnoses included primary neoplasia such as hepatocellular or biliary carcinoma, cystadenoma, hematoma, abscess, and nodular hyperplasia.
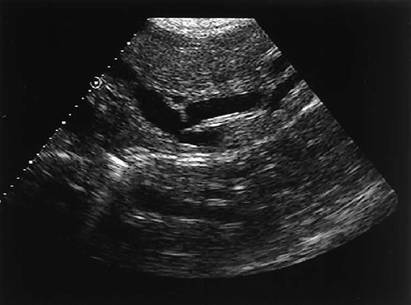
Figure 2-76 Transverse scan of the liver in a 4-year-old domestic short hair cat with intermittent vomiting and lethargy for 3 months and weight loss. There were marked elevations in liver enzyme levels, minor total bilirubin level elevation, and normal WBC. The anechoic tubular structures seen represent moderately dilated intrahepatic bile ducts. The dilation was due to a benign mass in the common bile duct (see Figure 2-80).
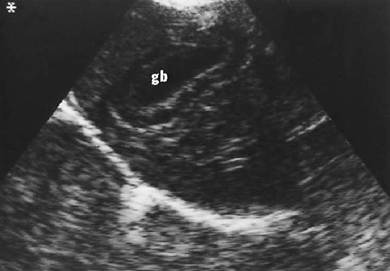
Figure 7,-77 Sagittal scan of a Chihuahua. Gallbladder (gb) has a well- defined hypoechoic rim. This change is associated with gallbladder wall edema and/or inflammation.
FIGURE 2-78 Sagittal scan of the gallbladder in a 16-year-old domestic short hair cat that was vomiting and not eating for 3 days. Liver enzyme levels were moderately elevated, and total bilirubin level was mildly elevated. The gallbladder wall is mildly thickened with irregular mucosal surface. Gallbladder size appears normal. The tiny hyperechoic foci deep to the gallbladder are biliary stones. Changes were consistent with either cholecystitis and/or mucinous hyperplasia.
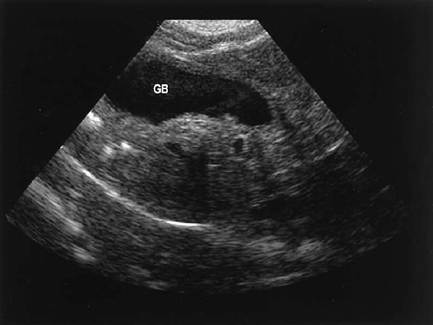
Figure 2-79 A, Sagittal scan of the common bile duct in the cat seen in Figure 2-78. The bile duct is markedly dilated with obstruction distally by a hyperechoic focus with acoustic shadowing, most likely a calculus. B, Oblique scan of the liver in the cat seen in A and in Figure 2-78. Numerous hyperechoic foci are seen throughout the liver, some following a linear course, most likely intrahepatic biliary calculi.
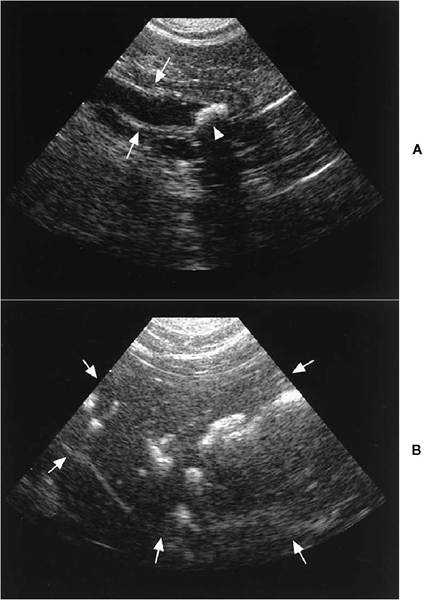
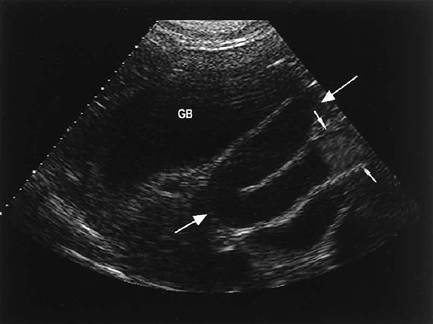
Figure 2-80 Oblique scan of the gallbladder (GB) and common bile duct (large arrows) in the cat seen in Figure 2-76. The bile duct is markedly dilated and is obstructed by an echogenic mass (small arrows) that appears to be intraluminal. The mass was determined to be benign fibroplasia of unknown cause.
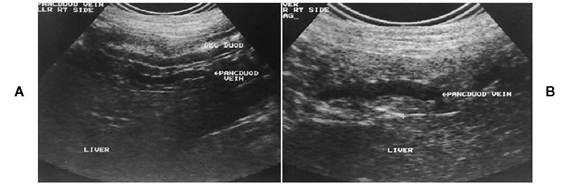
Figure 2-81 Sagittal scan of a normal dog pancreas showing the dorsal relationship to the duodenum (A) and the anechoic pancreaticoduodenal vein present within the pancreas (B).
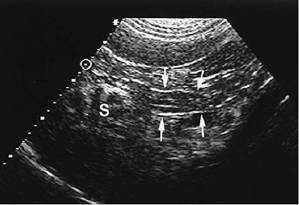
Figure 2-82 Sagittal scan of the left limb of the pancreas (arrows) in a normal cat. S, Stomach.
Pancreatic parenchyma is isoechoic to slightly hyperechoic compared with hepatic parenchyma, with a homogeneous echo pattern.
The right limb of the pancreas is best imaged with the patient in left lateral recumbency. A right intercostal approach is frequently necessary.
Sonographic Diagnosis of Pancreatic Disease
Acute Pancreatitis
Mild, acute pancreatitis may not be easily differentiated from normal pancreatic tissue, but in some cases the pancreas can be seen as mildly enlarged
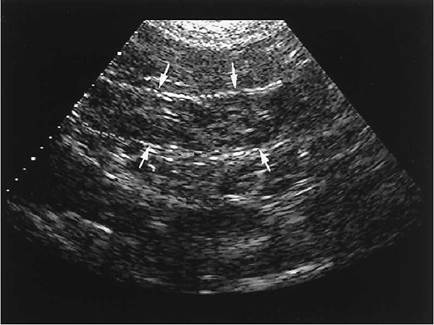
Figure 2-83 Sagittal scan of the pancreas (arrows) in an 8-year-old tortiseshell cat with a history of anorexia and hiding. The pancreas is mildly enlarged and nonhomogeneous with patchy hypoechoic zones and has slightly irregular margins. Sonographic diagnosis was pancreatic inflammation. The cat’s signs resolved with medical therapy.
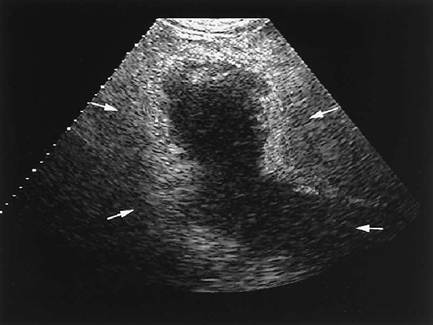
Figure 2-84 Oblique scan through the area of the pancreas in a 9-year-old poodle-mix with vomiting, diarrhea, shaking, anorexia, and fever. The WBC was 20,700, and the alkaline phosphatase level was mildly elevated. The pancreas is markedly enlarged, hypoechoic to anechoic, irregular in shape, and surrounded by hyperechoic tissue. Sonographic diagnosis was acute pancreatitis with localized peripancreatic inflammation. The dog recovered following 1 week of medical therapy.
and nonhomogeneous (Figure 2-83). The pancreas usually enlarges and is hypoechoic in moderate to severe pancreatitis. Anechoic cavitations may occur owing to necrosis, abscess, or hemorrhage (Figures 2-84 and 2-85). Peripancreatic hyperechoic mesentery and/or anechoic fluid may be visible. Decreased motility or thickening of proximal duodenum may be apparent. Intrahepatic and extra-
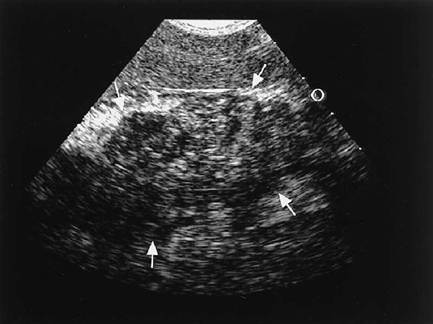
Figure 2-85 Oblique scan of the pancreas (arrows) in an 8-year-old Irish setter with shaking, groaning, and abdominal pain. Ingestion of garbage had occurred 2 days previously. There was mild elevation of alkaline phosphatase level. The pancreas appears markedly enlarged with mixed hypoechoic and anechoic zones surrounded by echogenic tissue. The anechoic regions were thought to be either hemorrhage and/or necrosis. Sonographic diagnosis was acute pancreatitis. Medical therapy was instituted, and a recheck ultrasound 1 week later showed approximately 50% decrease in size with persistent nonhomogeneous echo pattern. The dog continued to improve with resolution of signs 2 weeks later.
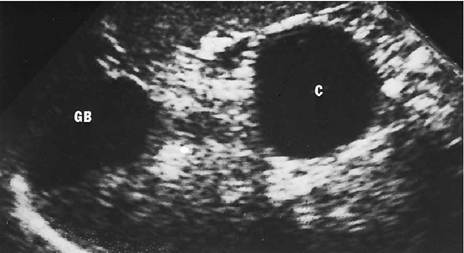
Figure 2-86 Sagittal liver scan of a mixed-breed dog presented with icterus and neurologic abnormalities. Gallbladder (GB) is distended. An anechoic cystic structure (C) is seen caudal to the gallbladder and liver. A pancreatic cyst was suspected. Laparotomy located a cystic bile-filled mass between the left and the right pancreatic limbs attached to omentum and an atrophic left pancreas. Diagnosis was a cystic structure with residual pancreatic tissue in the fibrous wall.
hepatic biliary duct obstruction may be observed. In the healing stage there may be homogeneous or irregular increased echogenicity, presumably due to fibrosis and/or calcification. Calcification may or may not show shadowing, depending on its thickness. Anechoic pseudocyst formation, either single or multiple, may occur (Figures 2-86 and 2-87). Nodular hyperplasia may develop in the pancreas (Figure 2-88), as well as diffuse pancreatic hyperplasia, which appears as a normal echogenicity but very enlarged with smooth borders, based on one case that was histologically confirmed.
FIGURE 2-87 Sagittal scan of the left pancreas (arrows) in a 12- year-old domestic short hair cat. Clinical signs were nonspecific anorexia and lethargy with normal results of blood tests. The pancreas is mildly enlarged, patchy hypoechoic, and irregular in shape and has a small anechoic structure that appears cystlike. Sonographic diagnosis was pancreatic inflammation with possible small cyst. The cat recovered with medical therapy.
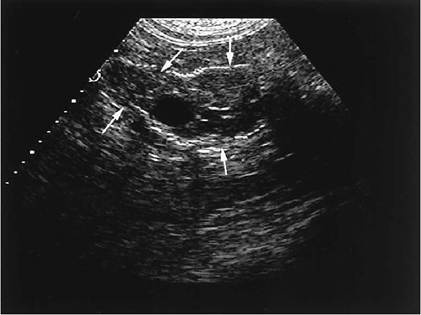
FIGURE 2-88 Images of the pancreas (arrows) in a 14-year- old domestic long hair cat with hematuria. The pancreas has several small (A) and large (B) hypoechoic nodules. At surgery for removal of cystic calculi, biopsy of a pancreatic nodule was performed, and the nodule was determined to be hyperplasia.
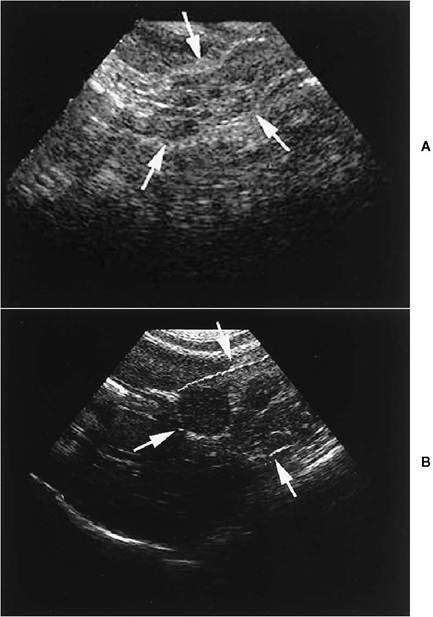
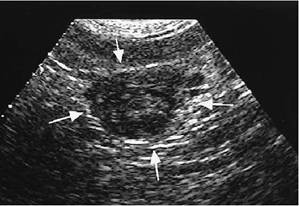
Figure 2-89 Scan of the pancreas (arrows) in a 10-year-old domestic medium hair cat with a history of weight loss and vomiting. There was a slight increase in lipase level, slight decrease in albumin level, and mild anemia. The pancreas has a circumscribed mixed hypoechogenic mass. Other areas of the pancreas imaged normally, but local lymph nodes were enlarged (not seen on this scan). Diagnosis was pancreatic andenocarcinoma.
Chronic Pancreatitis
The size of the pancreas may be normal or enlarged, with increased echogenicity or a mixed echo pattern. Calcification in pancreatic parenchyma may shadow. Biliary dilation may be observed, even when active obstruction no longer exists.
Pancreatic Masses
The pancreas is enlarged, and the mass may have well-defined borders. Masses may be hypoechoic or hyperechoic or have mixed echogenicity. Solid masses may be neoplasms, hematomas, granulomas, or abscesses (Figure 2-89). Large cystic lesions may occur in cystadenocarcinoma. Differentiation from pseudocyst is difficult; however, cystadenocarcinomas usually have an irregular wall thickness with small masses along at least one border of the cyst. Neoplastic processes may invade surrounding structures, especially adjacent vessels. Lymph node enlargement may be observed with neoplasia. Biliary obstruction may occur. Some tumors, such as insulinomas, are very small and difficult to identify.
References
Agut A,Wood AKW, Martin CA: Sonographic observations of the gastroduodenal junction of dogs, Am J Vet Res 57:1266,1996.
Baez JL et al.: Radiographic, ultrasonographic, and endoscopic findings in cats with inflammatory bowel disease of the stomach and small intestine: 33 cases (1990-1997),JAm Vet Med Assoc 215:349, 1999.
Biller DS, Kantrowitz B, Miyabayashi T: Ultrasonography of diffuse liver disease: a review, J Vet Intern Med 6:71, 1992.
Bostwick DR,Twedt DC: Intrahepatic and extrahepatic portal venous anomalies in dogs: 52 cases (1982-1993), JAm Vet Med Assoc 206:1181,1995.
Delaney F, O’Brien RT, Waller K: Ultrasonographic small intestinal thickness in normal dogs, ACVR meeting, Nov-Dec 1999, Chicago (abstract).
Etue S et al.: Ultrasonography of the normal feline pancreas, ACVR meeting, Nov-Dec 1999, Chicago (abstract).
Farrar ET, Washabau RJ, Saunders HM: Hepatic abscesses in dogs: 14 cases (1982-1994), J Am Vet Med Assoc 208:243, 1996.
Gagne JM et al.: Clinical features of inflammatory liver disease in cats: 41 cases (1983-1993), J Am Vet Med Assoc 214:513, 1999.
Hess RS et al.: Clinical, clinicopathologic, radiographic, and ultrasonographic abnormalities in dogs with fatal acute pancreatitis: 70 cases (1986-1995), J Am Vet Med Assoc 213:665, 1998.
Holt DE, Schelling CG, Saunders HM: Correlation of ultrasonographic findings with surgical, portographic, and necropsy findings in dogs and cats with portosystemic shunts: 63 cases (1987-1993), J Am Vet Med Assoc 207:1190, 1995.
Hunt GB, Mahoney P, Bellenger CR: Successful management of an iatrogenic biliary pseudocyst in a dog, J Am Anim Hosp Assoc 33:166,1997.
Jacobson LS, Kirberger RM, Nesbit JW: Hepatic ultrasonography and pathological findings in dogs with hepatocutaneous syndrome: new concepts, J Vet Intern Med 9:399, 1995.
Lamb CR: Abdominal ultrasonography in small animals: examination of the liver, spleen and pancreas, J Small Anim Pract 31:6, 1990.
Leveille R, Biller DS, Shiroma JT: Sonographic evaluation of the common bile duct in cats, J Vet Intern Med 10:296, 1996.
Morita Y et al.: Endoscopic ultrasonographic findings of the pancreas after pancreatic duct ligation in the dog, Vet Radiol Ultrasound 39:557, 1998.
Morita Y et al.: Endoscopic ultrasonography of the pancreas in the dog, Vet Radiol Ultrasound 39:552, 1998.
Newell SM et al.: Correlations between ultrasonographic findings and specific hepatic diseases in cats: 72 cases (1985-1997), J Am Vet Med Assoc 213:94, 1998.
Newell SM et al.: Sonography of the normal feline gastrointestinal tract, Vet Radiol Ultrasound 40:40, 1999.
Nyland TG, Koblik PD, Tellyer SE: Ultrasonographic evaluation of biliary cystadenomas in cats, Vet Radiol Ultrasound 40:300, 1999.
Penninck DG, Moore AS, Gliatto J: Ultrasonography of canine gastric epithelial neoplasia, Vet Radiol Ultrasound 39:342, 1998.
Rivers BJ et al.: Canine gastric neoplasia: utility of ultrasonography in diagnosis,JAm Anim Hosp Assoc 33:144, 1997.
Schwarz LA, Penninck DG, Leveille-Webster C: Hepatic abscesses in 13 dogs: a review of the ultrasonographic findings, clinical data and therapeutic options, Vet Radiol Ultrasound 39:357,1998.
Weiss DJ, Gagne JM, Armstrong PJ: Relationship between inflammatory hepatic disease and inflammatory bowel disease, pancreatitis, and nephritis in cats, JAm Vet Med Assoc 209:1114, 1996.
Whiteley MB et al.: Ultrasonographic appearance of primary and metastatic canine hepatic tumors: a review of 48 cases,J Ultrasound Med 8:621,1989.
Yeager AE, Mohammed H: Accuracy of ultrasonography in the detection of severe hepatic lipidosis in cats, Am J Vet Res 53:597, 1992.