EXCITABILITY CURVE OR STRENGTH-DURATION CURVE
The strength-duration curve, also called the excitability curve, is a visual representation of the correlation between the intensity of an electrical stimulus at a muscle’s motor point and the pulse’s duration (Figure 7.12).
This curve is used to assess nerve damage in lower motor neurone lesions. There are two main types of curves: the “nerve curve” and the “muscle curve.” The muscle curve indicates a scenario where all nerve fibres supplying the muscle have degenerated, resulting in a steep and right-shifted curve. Two crucial parameters on the strength-duration curve are rheobase and chronaxie. The term “rheobase” refers to the smallest amount of electrical current necessary to trigger a neural response, regardless of how long the current is applied, while chronaxie is the time needed for a stimulus of twice the rheobase strength to elicit a response. Chronaxie is inversely proportional to
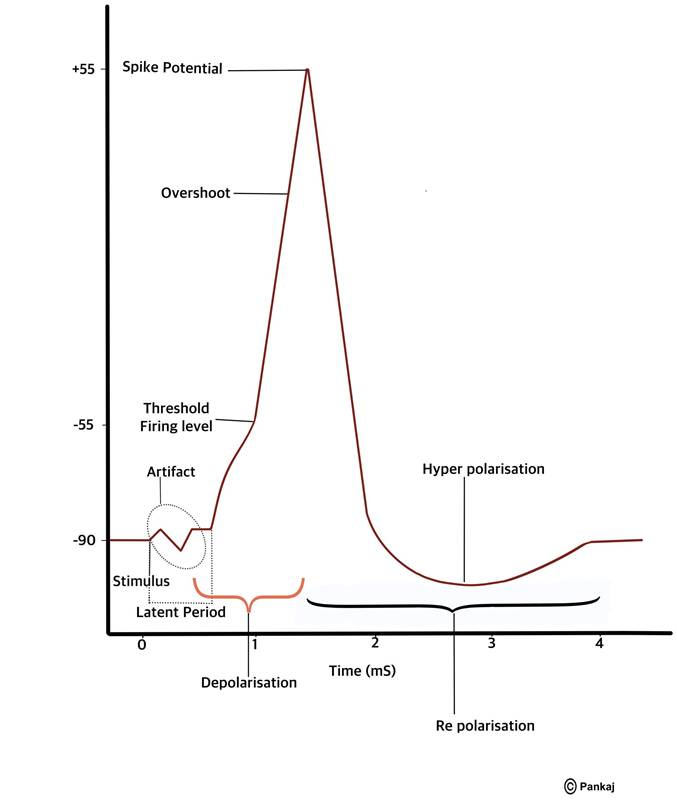
FIGURE 7.11 Graph shows the change in membrane potential after the application of the stimulus.
excitability, indicating that its value is higher for denervated muscles. The curve is influenced by various factors such as skin resistance, subcutaneous tissue, temperature, electrode characteristics, age, and fatigue. It is also used to evaluate sensory deficits in peripheral neuropathy and assess nerve injury.
7.10