Genomic analysis
6.1 Approach using candidate genes
The candidate gene approach consists in selecting a particular gene considered as the most likely site of a mutation. The main criteria for selecting a gene as a candidate are the following: 1) genes are selected because they are defective in similar animal species (usually humans or mice) 2) genes are selected based on their function.
The analysis of the candidate gene consists in sequencing the entire gene and comparing two groups (healthy vs sick animals). However, the presence of a mutation in a gene is not in itself sufficient to identify the cause of the disorder. Unfortunately, for many genetic diseases the relative candidate gene has not been identified and very similar hereditary diseases can result from mutations on completely different genes. As an example, in the Bedlington terrier dog breed, the hereditary copper toxicosis is phenotypically identical to the Wilson’s disease in humans. However, the gene involved in the human disease is not responsible for the disease in dogs. In conclusion, the approach with candidate genes has the advantage of allowing the identification of the specific mutation and therefore the creation of a targeted genetic tests.6.2 Linkage analysis
The method of linkage analysis is based on completely different assumptions from the candidate gene approach. The main difference is that no assumptions are made about which gene is responsible for the disease, nor, more generally, the chromosomal tract involved. In this method, the whole genome is potentially subjected to analysis, without directing attention to any particular region. The search for the causal mutation takes place through the use of genetic markers whose chromosomal position is known. The more such markers are physically close to the mutation site, the more likely they will be co-inherited together with the mutation from one parental generation to the next.
In a very simplified way, linkage analysis evaluates whether any of the variants of the markers appear in the population is associated with the presence of the disease. The ideal markers, and normally used to perform this type of study, are microsatellites, considered as practically ideal genetic markers because they are abundantly scattered throughout the genome and generally highly polymorphic. The number of microsatellites used to perform a linkage analysis is not fixed but generally the higher it is, the higher the probability that the study has success. This assumption derives from the fact that not directing attention towards specific genes and particular chromosomal portion, genome screening it must be as large as possible, i.e. it must contain the highest possible number of markers in order to understand the whole genome (so-called genomewide screening). Generally, to perform a linkage study within a family tree informative are employed between 200 and 300 microsatellites using pedigrees with at least a hundred animals. For a given area of the genome, the probability of a recombination event occurring between a marker and a disease gene is directly proportional to their distance. The probability of occurrence of this event is expressed as a recombination fraction (θ). If θ is equal to 0.5, the marker and the disease gene are not linked and are therefore independently segregated. In other words, the probability that the marker and gene are inherited, associated or separated is identical. Conversely, if the marker and disease gene are linked together, the θ is less than 0.5. The lod score (Z) is the parameter which is used to estimate the linkage between 2 genetic loci. Z is the logarithm of the ratio between the probability that the 2 loci are linked (θ 700 bp) with a very low error (600 US $ per Gb). This technique was subsequently improved through the use of the Celera assembler with a significant reduction in time and costs. New generation sequencing technologies (Next Generation Sequencing - NGS), also known as High Throughput Sequencing (HTS) technologies, have evolved rapidly offering an ever greater number of sequenced bases at a lower cost. In 2006, the first second- generation NGS technologies (Second-Generation Sequencing - SGS) appeared. Illumina (MiSeq, HiSeq and NovaSeq) is the most popular platform, due to its high performance and low cost. This technology is based on the fragmentation of DNA, amplification in multiple reactions in parallel, obtaining short reads, between 100 and 300 bp. Depending on the library, it is possible to sequence only one end of the fragment, single reads (single end) or both ends. The distance between the read pairs is called insert size (mate pair (2-5 kb); paired end (2000 US$ per Gb). These techniques do not require the libraryamplification step and they are capable of directly sequencing a single DNA molecule, without applying any enzymatic or hybridization process. The main platforms of the third generation are Pacific Biosciences (PacBio) and Oxford Nanopore Technologies (ONT). These platforms produce longer reads than the previous ones (5-50 kb) but have a much higher error rate. The Pacbio platform routinely generates reads with an N50 > 1 Mb and it has recently reduced the error rate with a new technique (circular consensus sequencing) and the production of high fidelity reads of 15 Kb. The most popular softwares used for the bio-informatic analysis are Canu; Marvel and Mecat Flye. Then, results obtained are cleaned with some software such as Racon; Nanopolish and Pilon. Figure 1 shows an example of workflow using long reads.After identifying the putative protein coding regions (CDSs), UCEs (Ultra Conserved Elements), it is possible to infer the correct reading pattern (Open Reading Frames, ORF) and translate the nucleotide sequences into amino acids [22]. In this way, we will obtain the set of predicted proteins encoded by the study genome. BLAST (nucleotide, protein, translated, genomes), HMMER or InterProScan databases can be used to functionally annotate these proteins. InterProScan provides the information on functional processes (GO terms) and metabolic pathways (KEGG).
Once the functional and structural annotation has been obtained, the analysis of the functional elements of interest such as polymorphic positions or genes with differential expression can be performed. Figure 2 shows an example of workflow for the genomic annotation analysis.Orthmcm, Orthofinder; EggNog sofwares can be used for the homology analysis. Several studies, in recent years, have shown that the best way to understand complex systems (for example diseases) is to combine different omic data together. Figure 3 shows a detailed analysis using omic data (genomic, transcrptomics, proteomics and metabolomics).
6.5 Reduced representation genome sequencing (RRGS)
Several new techniques have been developed in the last decade. The most popular is the restriction-site-associated DNA sequencing (RAD-Seq) [23] and the genotyping by sequencing method (GBS) [24]. The main advantage of RRGS methods is that it reduces the cost of analysis with an high coverage compared to the traditional sequencing methods. The de novo analysis does not require a priori knowledge of the reference genome sequence. Several applications of the RAD- Seq methods have been reported: population genetics studies (phylogenetic and
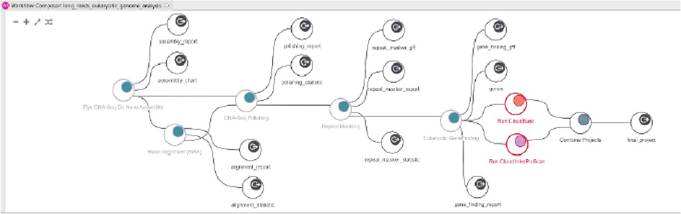
Figure 1.
Example of NGS bioinformatic analysis (long read sequencing).
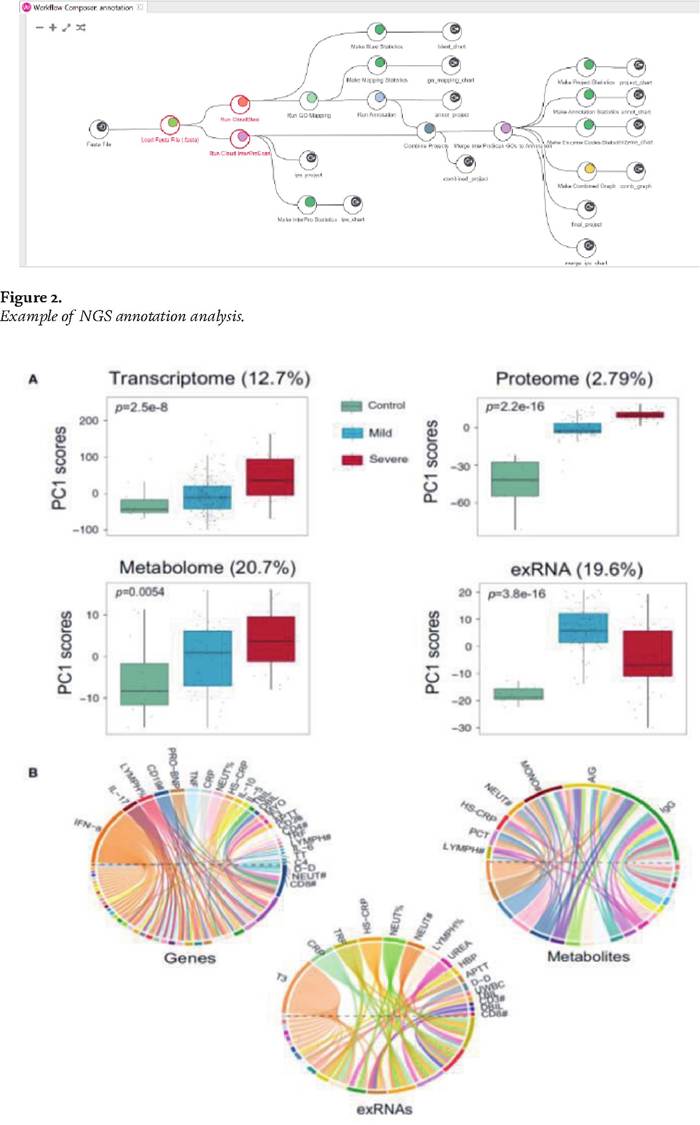
Figure 3.
Example of OMICs analysis (genomics,^ranscrptomics, proteomics and metabolomics).
phylogeographic), linkage mapping (fine scale) and genome scaffolding [25]. To avoid or reduce the bias, some variations of the original RAD Seq protocol have been proposed: ddRAD, ezRAD, 2b-RAD. Classic RAD reads are obtained between the restriction site and a random site while the ddRAD reads are obtained between two restriction sites. In particular, the ddRAD-SEq method increases the number of samples per sequencing line and develops a tagging approach by combining pairs of adapters.
Another advantage is the selection of the fragment sizes. This reduces duplicate sampling of a region, thus requiring only half the reads to effectively achieve high levels of confidence for each SNP associated with a restriction enzyme cleavage site. All these properties make the ddRAD-Seq method robust, allowing to search for a smaller number of reads. The bio-informatic analysis of RAD-Seq data includes the following phases: quality control, trimming, reference genome or de novo mapping methods, SNP filtering/annotation. The results of RAD-Seq analysis are analyzed with different softwares such as Stacks, Ig-Tree, Uneak (Tassel), Pyrad; Ddocent; 2brad and Aftrrad. The most popular software is the Stacks program. RRL methods, in relation to the production of short reads, are not very useful for the construction of phylogenetic trees but are generally used for the analysis of SNPs.6.6 Genome-wide genotyping arrays
In the recent years, the availability of massive genomic data obtained from the last generation sequencing techniques allowed the efficient identification of a large number of SNPs [26]. The GWAS is a method of investigation that allows to examine the entire genome by analyzing the single nucleotide polymorphism of genomic markers (SNPs) with the use of high density SNP arrays [27] (the last versions Illumina Canine HD SNP 170 K have hundreds of thousands of SNPs distributed throughout the genome). The study identified the genetic structure of the populations present in Italy and the selection signatures. Reduction of genotyping costs is achieved using inference methods such as the imputation. Imputation techniques allow to transfer information from DNA from high density bead chips to low density ones.
6.6.1 Genome-wide association studies
The genome-wide association studies (GWAS) have been proposed as an effective approach for the identification of many causative mutations and genetic factors that constitute the main traits. Unlike linkage studies, which consider the phenomenon of inheritance of chromosomal regions linked to the presence of a trait within a family, association studies consider instead the difference between the frequency of SNPs affecting the trait of interest.
Association studies may be conducted through two approaches: direct and indirect. A direct association study is to catalog and test one by one all the possible causal mutations. However, the direct approach presents some practical problems. This strategy involves genome-wide identification of all genes (up to 19,000 genes) as well as of all SNPs. For these reasons, the use of the direct method is limited to a few cases and it has almost always replaced with the application of the indirect method. The indirect strategy avoids the need to catalog all mutations that could potentially give predisposition to a given trait and instead relies on the association between a giver phenotype and markers located near a strategic locus. These associations are obtained from studies of linkage disequilibrium (LD) between marker loci. The indirect strategy, then employs a dense map of polymorphic markers to explore the genome in a systematic way. The choice of markers differentiates further the indirect approach in two different strategies. In the first, markers are chosen very close to exon regions of known genes. The second employs markers located in large regions, virtually anywhere in the genome, thus considering the chromosomes in their entirety, including intronic regions. The choice of the marker falls on bi-allelic SNPs because of their high frequency in the animal genomes, for the low rate of mutation and for the ease with which it can be analyzed. Linkage means the presence of genes in closed loci on the same chromosome. LD is a combination of alleles at two or more loci that occurs more often than it does happen by chance. Two markers are in LD when they occur together in the same individual more frequently than would be expected by chance. The presence of a LD thus indicates co-segregation of two markers. In generally, the LD between two SNPs decreases with the physical distance and the extent of LD varies strongly among the regions of the genome. LD analysis is a valuable tool for fine mapping. Doherty [28] conducted an GWAS analysis using 9700 SNPs on 72,000 dogs (63 breeds). Eight SNPs were significantly correlated with the live weight and five SNPs with cancer mortality. Plassais [29] analyzed the genomes (WGS) of 722 dogs and used the Illumina canine HD SNP BeadArray to identify over 91 million SNPs. In this way the main SNPs coding for body weight and main morphological characters were identified. In Table 2 is reported an example of SNP genotyping using a SNP chip array in dogs [30].6.7Scans for selective sweeps
The domestic dog is thought to be the most recent species of the canine family, within which three phylogenetic groups, or clades, are distinguished: the domestic dog belongs to the same clade as the gray wolf, coyote and jackals [31]. It is thought that the dog appeared about 40,000 years ago, and that the first steps in its domestication took place in East Asia [32]. Most of the domestic breeds we know today, however, are the result of human selection over the past two or three centuries. Many of the most popular modern breeds were created in Europe in the 19th century. Some of the breeds were already present in the ancient world as the greyhound and the dog of the pharaohs. Studies conducted at the genomic level have highlighted a stratification of genetic variability within dog breeds. The recent sequencing methods and the use of SNP arrays allow the screening of the whole genome for the presence of signatures of selection. Sequencing data are aligned to the reference genome to identify selective sweeps. The presence of genes with
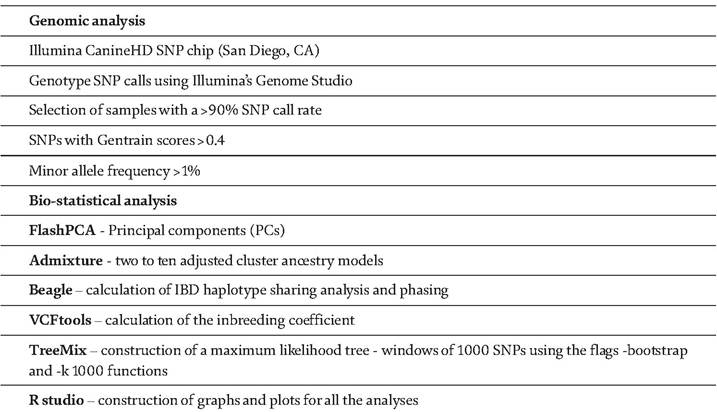
Table 2.
SNPgenotyping using a SNP chip array in dogs.
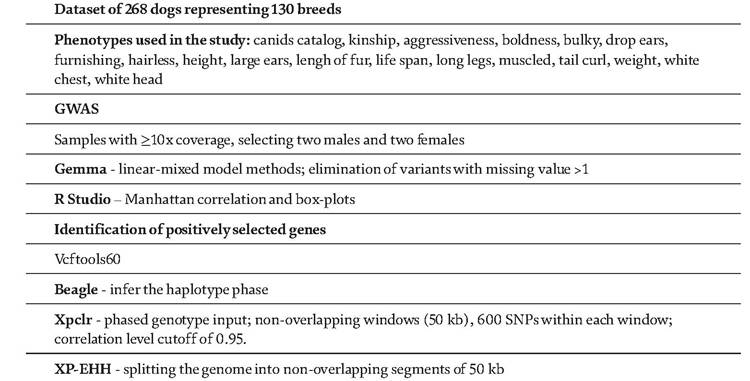
Table 3.
Example of GWAS and selective sweep analysis in dogs.
a large number of outliers indicates a positive or negative effect of selection. A genome scan approach can be used to distinguish genome-wide processes (expected to mainly reflect demographic histories) from processes at individual loci. Genome scans may suffer from inflated numbers of false positives under hierarchical spatial structure coupled with isolation by-distance dynamics. In the case of positive selection, there is an increase in the fitness of the population due to a new (or rare) mutation. In the case of hard sweeps, there is an increase in the frequency of some variants and in the linkage disequilibrium. Kim et al. [33] compared 127 dogs (sport-hunting vs. terrier) for sporting characteristics. Results of the study showed the main SNPs (cardio-circulatory, muscular and neuronal systems) and selection signature that are involved in the sport-hunting breeds. In Table 3 is reported an example of GWAS and selective sweep analysis in dogs [29].
7.