PRACTICE QUESTIONS
1. In the normal cardiac cycle:
a. Ventricular systole and ventricular ejection begin at the same time.
b. The second heart sound coincides with the beginning of isovolumetric relaxation.
c. The highest left ventricular pressure is reached just as the aortic valve closes.
d. Aortic pressure is highest at the beginning of ventricular systole.
e. Atrial systole occurs during rapid ventricular ejection.
2. Figure 21-11 shows a plot of the changes in pressure and volume that occur in the left ventricle during one cardiac cycle. Which of the following is true?
a. Point D marks the beginning of isovolumetric relaxation.
b. Point B marks the closure of the aortic valve.
c. Point C marks the opening of the mitral valve.
d. Point A marks the beginning of isovolumetric
ωntraς∣jQ∏l
e. Point D marks the beginning of ventricular systole.
3. Which statement is true for a normal heart?
a. Sympathetic activation causes end-systolic ventricular volume to increase.
b. An increase in ventricular preload causes end-diastolic ventricular volume to decrease.
c. An increase in ventricular contractility causes systolic- duration to increase.
d. An increase in ventricular contractility causes the external work of the heart to decrease.
e. Pacing the heart at a high rate causes stroke volume to decrease.
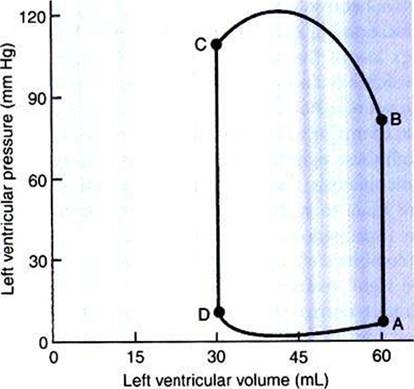
FIGURE 21-11 Closed loop depicts the changes in left ventricular pressure and volume that occur during one cardiac cycle. Practice Question 2 is based on this graph.The first step in understanding the figure is to determine whether the normal sequence of events proceeds clockwise or counterclockwise around the loop.To make this distinction, recall that the ventricles fill when ventricular pressure is low and they empty when ventricular pressure is high. Next, identify the phases of the cardiac cycle that correspond with each limb of the loop.
Finally, determine what happens to the mitral and aortic valves at each corner of the loop. Hint: A, B, Cf and D in this figure match the similarly labeled points in Figure 21-1 (graph of ventricular pressure).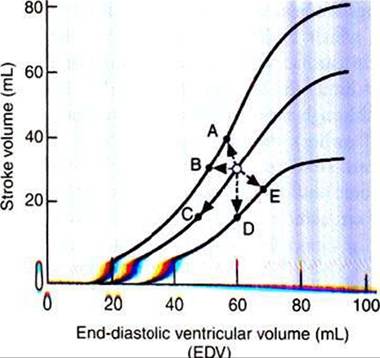
FIGURE 21-12 Practice Question 4 is based on this graph of three ventricular function curves.
4. Starting at the open circle in Figure 21-12, which point would be reached after the contractility decreased and the
| preload increased? | |
| a. | Point A |
| b. | Point B |
| c. | Point C |
| d. | Point D |
| e. | Point E |
5. You examine a 7-year-old poodle and find evidence of a systolic murmur (no diastolic murmur), pulmonary edema (indicated by rapid, noisy respiration and cough), left ventricular hypertrophy (no right ventricular hypertrophy), and exercise intolerance. The most likely explanation for the symptoms is:
a. Mitral regurgitation
b. Mitral stenosis
c. Aortic regurgitation
d. Pulmonic stenosis
e. Ventricular septal defect