Approach to the Diagnosis and Management of Weight Loss in Adult Ruminants
1. Take a general history and a diet history.
a. General history: Question the caretaker closely about any clinical signs that might indicate a primary disease (e.g., diarrhea, coughing, dysphagia, polyuria, depression, agalactia).
Note if body condition is less than desired. Quantitate the weight loss or BCS if possible. Acute weight loss of 5% to 10% is quite significant. Carefully note the production level of the animal or herd (e.g., pregnancy [single, twins, triplets], lactation [level of milk production]). Evaluate the parasite control program. Does the herd have a history of chronic or recurrent disease (Johne's disease, bovine virus diarrhea, subacute ruminal acidosis, mastitis, pneumonia)?b. Diet history: Obtain an accurate dietary history, particularly when signs of a primary disease are absent. Inspect all forages, concentrates, and feed additives for quality, signs of spoilage, abnormal color or odor, and quantity on hand. Be sure the feeding system allows for adequate consumption by all animals and that competition for feedstuffs does not occur, for example, due to a lack of bunk space in freestall barns. Check to see if the feeding program was changed before the onset of observed weight loss or loss of body condition. The history should include the weight of each feedstuff and supplement fed and consumed per day. The maximum DMI can be predicted for different types of cattle using the equations given in Table 9.1.
c. Determine or estimate the nutrient analysis of the feedstuffs being fed. Examine the environment for possible toxic plants or substances.
2. Perform a physical examination. Examine patients carefully for signs of concurrent disease (e.g., diarrhea, decreased ruminal motility, pyrexia, dysphagia, abnormal dentition, melena, icterus, mastitis, metritis, dyspnea, tachycardia). Is the patient hungry? Weigh the patient (or use a heartgirth measurement) and note the BCS (see Tables 9.14 and 9.15 and Fig.
9.2). Observe the patient for signs of muscle wasting and the presence or absence of subcutaneous fat. Test the milk with nitroprusside powder (a positive reaction indicates an acetoacetate concentrate above 5 mg/dL and is diagnostic of ketonlactia and ketonemia), or measure the ketone concentration in the urine. In order to detectsubclinical ketosis with higher accuracy, it is beneficial to use hand-held devices that measure β-hydroxybutyrate (BHB) in whole blood.20 The level of nonesterified fatty acids is a good indicator for excessive body fat mobilization, especially in close-up cows. Measure the ruminal pH (pH above 7 is indicative of anorexia). Examine the skin for evidence of lice or keds.
3. Examine the feces. Perform flotation, sedimentation, and Baermann's procedures to detect patent parasitic infestations. If the feces test positive for occult blood or are dark, see the section on melena in Chapter 7. If there is evidence of or apparent diarrhea, see the section on diarrhea in Chapter 7.
4. Perform blood analysis.
a. Perform a CBC including plasma protein and fibrinogen. Interpret for evidence of inflammation, and characterize the anemia if present. Analyze for blood selenium concentration or glutathione peroxidase activity if a herd problem of weight loss exists in a selenium-deficient region.
b. Perform a serum chemistry analysis. The serum albumin half-life is approximately 16.5 days in cattle and 14 days in sheep and goats. Hypoalbuminemia is associated with internal abscessation, PCM, liver disease, renal disease, and Johne's disease, among other conditions. In the first two of these conditions, albumin is often normal until the patient is near death, whereas with protein-losing renal or gastrointestinal disease or with failure to make albumin in severe hepatic disease, hypoalbuminemia is often seen by the time noticeable weight loss occurs. Globulins, particularly γ-globulins, may be increased with inflammation, and the albumin/globulin ratio may
■ TABLE 9.14
Body Conditioning Scoring System for Beef Cows
| Group | Score | Definition |
| Thin condition | 1 | Emaciated (body fat = 3.8%) The cow is severely emaciated and physically weak. Bone structure of shoulder, ribs, spinous processes, transverse processes, hooks, and pins are sharp to the touch and easily visible. No evidence of fat deposits or normal muscling. Cattle in this score are extremely rare and are usually inflicted with a disease and/or parasitism. |
| 2 | Very thin (body fat = 7.5%) The cow appears emaciated, similar to 1, above, but not weak. Muscle atrophy is significant in the shoulder, over the loin and rump, and through the hindquarters. The spinous and transverse processes, hooks, and pins feel sharp to the touch and are easily seen. Ribs can be easily identified. | |
| 3 | Thin (body fat = 11.3%) The cow appears thin with no fat in the brisket. There is evidence of muscle atrophy over the shoulder, lion, and rump and through the hindquarter, but there is the beginning of some fat deposition over the shoulder, loin, and rump. The foreribs have slight evidence of fat deposition, but the last 3 or more ribs (11th, 12th, and 13th) are visible. Vertebrae of the spine are easily visible and can be identified individually by touch. Spaces between the processes have some evidence of some fat infiltration. Bone structure of the hooks and pins are evident under the hide. | |
| Borderline | 4 | Borderline (body fat = 15.1%) |
| condition | The cow appears thin, with the last 2 ribs (12th and 13th) easily visible, especially in mature cows with a big spring of rib and broad, flat ribs. Muscle atrophy over the shoulders and loin and through the hindquarters is evident but approaching normal. Movement of the muscles in the shoulder is prominent just under the hide as the animal moves. Individual spinous processes along the topline, and transverse processes along the edge of the loin between the hooks and last rib, are not visible, but can be easily palpated with minimal pressure and feel rounded rather than sharp. The hooks and pins are covered in minimal fat and easily identified. | |
| Optimum moderate | 5 | Moderate (body fat = 18.8%) |
| condition | There is a slight evidence of fat deposition in the brisket. Muscle expression in the shoulder, loin, rump, and hindquarters are normal. A thin layer of fat covers the muscles in the shoulder, and when the animal is in motion; the muscle and scapula movement under the hide are not prominent. The last 2 ribs can only be seen if the cow has less than normal gut fill. Individual spinous processes along the topline and transverse processes along the loin edge between the hooks and last rib appear smooth and are not visible, but they can be palpated with firm pressure. The hooks and pins are covered with a layer of fat, but still distinguishable. Areas on each side of the tail head are fairly smooth, but not mounded. | |
| 6 | Good (body fat = 22.6%) Some fat deposition in the brisket is evident. The cow exhibits a smooth appearance throughout without any evidence of muscle atrophy. A layer of fat covers the muscles in the shoulder, and shoulder movement visually takes on a fluid motion. There is noticeable sponginess over the foreribs just behind the shoulder. The ribs on young cows are fully covered by fat and cannot be detected visually. Flat, wide ribs on older cows may be seen. The spinous processes along the topline and transverse processes between the hooks and last rib are embedded in muscle and fat and can only be felt with firm pressure. The hooks are embedded in fat and appear round and smooth. The pins are embedded in fat, and there is noticeable sponginess on each side of the tail head. | |
| 7 | Fleshy (body fat = 26.4%) The brisket is full but not distended. A layer of fat covers the muscles in the shoulder, and the movement appears fluid. The ribs appear smooth, and there is a uniform layer of fat from the forerib to the last rib. The spinous processes along the topline and transverse processes between the hooks and last rib are embedded in fat, and the topline is beginning to take on a square appearance. The pins are embedded in a layer of spongy fat, and there are pones of fat forming on either side of the tail head. | |
| Fat condition | 8 | Obese (body fat = 30.2%) The neck appears short and thick and the brisket is distended with fat. There is no evidence of bone structure in the shoulder, along the topline, hooks, or pins. A thick layer of fat covers the shoulder, and shoulder muscle movement under the hide is not evident. The animal appears very square and blocky over the topline and smooth along the sides. Fat cover over the shoulder, topline, and ribs appear spongy both visually and by touch. The pins are embedded in pones of fat on both sides of the tail head. There is evidence of fat deposition in the udder. Animal movement may be somewhat impaired due to excess fat. |
| 9 | Very obese (body fat = 33.9%) These cows are very obese and are rarely seen. The animal appears very square and blocky over the topline, smooth along the sides, and spongy throughout. Bone structures are difficult to identify, and the animal appears short necked with a full, distended brisket. The pins are embedded in patchy pone fat on both sides and over the top of the tailhead. There is evidence of significant fat deposition in the udder. Animal mobility may be seriously impaired due to excess fat. |
■ TABLE 9.15
Body Condition Scoring System for Sheep
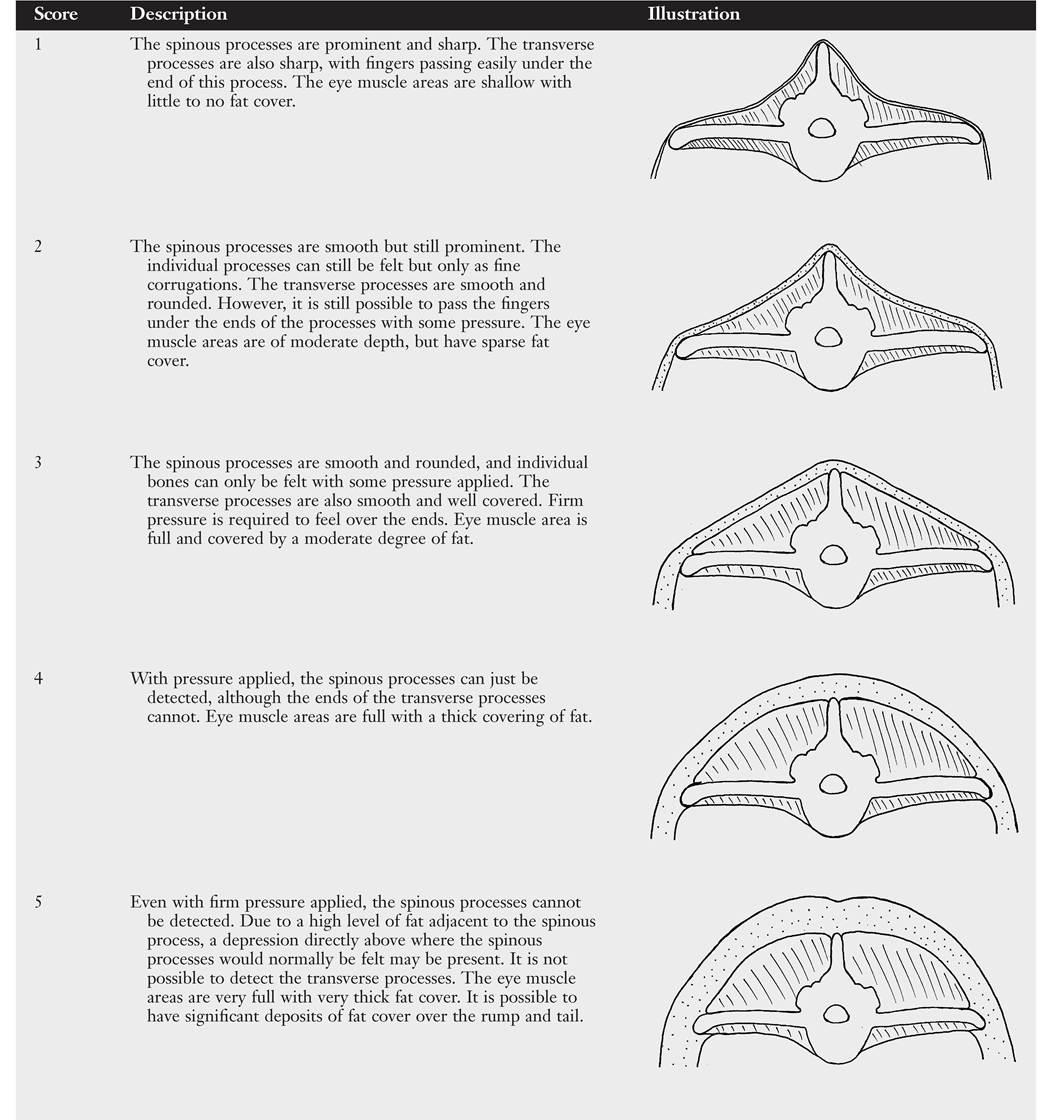
From Kenyon PR, Maloney SK, Blache D.
Review of sheep body condition score in relation to production characteristics. N Z J Ag Res 57:38-64, 2014.be decreased. The serum glucose concentration is usually not helpful in determining the cause or causes of weight loss. An elevated serum GGT (>25 IU/L) may indicate hepatic disease or, in rare cases, pancreatic disease. Serum BUN is often low with PCM in ruminants because of salivary urea recycling. Serum (total) calcium may be decreased with hypoalbuminemia, anorexia, or periparturient hypocalcemia. Serum phosphorus may be increased during severe starvation or Johne's disease or decreased with anorexia. The serum (plasma) copper concentration may be decreased if a herd problem of copper deficiency exists. Weight loss is particularly associated with copper deficiency when diarrhea is present in a region known to be copper deficient or in a region with excess dietary molybdenum or sulfates or both. A low serum copper concentration (below 0.5 μg∕mL or ppm) indicates deficiency. Ketonemia may be associated with anorexia. Hand-held meters measuring BHB concentrations have been reported to be a useful tool in diagnosing pregnancy toxemia in pregnant sheep.21 BHB concentrations ≥1.0 mmol/L indicate that the animals are at greater risk to develop severe hyperketonemia.22
5. Analyze the diet and improve the feeding program. Is the feed quantity and quality adequate to allow sufficient intake of nutrients? Compare the nutrient intake from the diet with the requirements for the appropriate species (Tables 9.16 to 9.20). Consider any important environmental and management factors in the daily nutrient requirements. Review nutrient analysis profiles on the feeds and total mixed ration (TMR) ingredients. Is the TMR mixed properly? Are grain rations mixed properly? Is too much grain being fed to the animal or herd? Analyze the pasture,
■ TABLE 9.16
Daily Nutrient Requirements for Lactating Dairy Cows at Various Production Levels
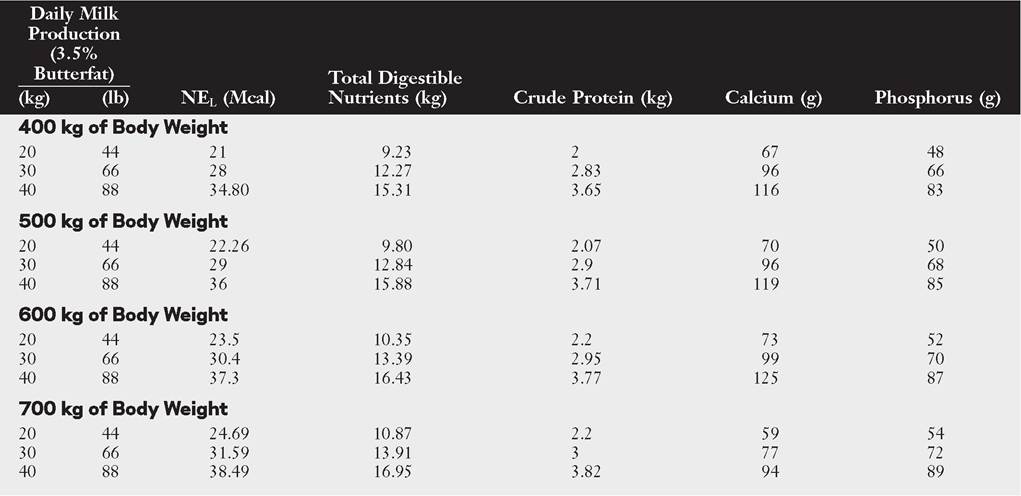
Modified from National Research Council (NRC). Nutrient requirements of dairy cattle. Washington, DC, 2001, National Academy of Sciences, NRC.
NEl, Net energy of lactation. Maintenance requirements can be calculated by the following formula: Maintenance NEl= 0.080 Mcal/kg BW0'75. The energy requirement for milk production when only the butterfat content of the milk is known by the following formula: NEl (Mcal/kg milk) + 0.360 + (0.0969 [fat%]).
■ TABLE 9.17
Daily Nutrient Requirements for Mature Beef Cows
| Reproductive Status | Total Gain (kg) | NEm (Mcal/day) | Metabolizable Protein (g/d) | Calcium (g) | Phosphorus (g) |
| Mature 550-kg Beef Cow | |||||
| Nonpregnant, maintenance | 0 | 10.5 | 432 | 16.9 | 12.9 |
| Pregnant, third trimester | 29-64 kga | 22.4 | 0.73 | 25 | 20 |
| Lactating, 20 lb milk per day | 0 | 29 | 1.18 | 38 | 27 |
Modified from National Research Council. Nutrient requirements of beef cattle, ed 8. Washington, D.C., 2016, National Academy Press. aThis gain represents only the weight of the gravid uterus.
■ TABLE 9.18
Daily Nutrient Requirements for Growing Bulls: Maintenance and Growth (900-kg mature SBW)
| Weight (kg) | Daily Gain (kg) | Net Energy (Mcal/day) | Metabolizable Protein (g/d) | Calcium (g/d) | Phosphorus (g/d) |
| 600 | 0 | 10.7 | 461 | 18.5 | 14.1 |
| 600 | 0.8 | 14 | 700 | 35.2 | 20.9 |
| 600 | 2 | 19.7 | 1014 | 57.1 | 29.7 |
| 700 | 0 | 12.1 | 517 | 21.6 | 16.5 |
| 700 | 0.8 | 15.8 | 732 | 36.6 | 22.6 |
| 700 | 2 | 22.2 | 1004 | 55.6 | 30.2 |
| 800 | 0 | 13.3 | 572 | 24.6 | 18.8 |
| 800 | 0.8 | 17.4 | 764 | 38 | 24.2 |
| 800 | 2 | 24.4 | 995 | 54.2 | 30.7 |
Modified from National Research Council. Nutrient requirements of beef cattle, ed 8. Washington, DC, 2016, National Academy Press.
| ■ TABLE 9.19 | |||||
| Daily Nutrient Requirements of Sheep | |||||
| Body Weight | Metabolizable | Total Digestible | Metabolizable | Calcium | Phosphorus |
| (kg) (lb) | Energy (ME) (Mcal) | Nutrients (g) | Protein (g) | (g) | (g) |
Maintenance, Mature Ewes
| 60 | 132 | 2.01 | 560 | 53 | 2.2 | 1.8 |
| 80 | 176 | 2.49 | 690 | 66 | 2.6 | 2.2 |
| 100 | 220 | 2.94 | 820 | 78 | 3.0 | 2.7 |
| 120 | 264 | 3.37 | 940 | 90 | 3.3 | 3.1 |
Breeding, Mature Ewes
| 60 | 132 | 2.21 | 610 | 62 | 2.6 | 2.1 |
| 80 | 176 | 2.74 | 760 | 77 | 3.1 | 2.7 |
| 100 | 220 | 3.24 | 900 | 92 | 3.6 | 3.2 |
| 120 | 264 | 3.71 | 1030 | 106 | 4.0 | 3.7 |
Early Gestation, Mature Ewes, Twin Lambs; BW = 3.4-6.6 kg
| 60 | 132 | 2.89 | 800 | 87 | 5.9 | 4.2 |
| 176 | 3.52 | 980 | 105 | 7.0 | 5.1 | |
| 100 | 220 | 4.10 | 1140 | 123 | 7.9 | 5.9 |
| 120 | 264 | 4.66 | 1290 | 139 | 8.7 | 6.6 |
Late Gestation, Mature Ewes, Twin Lambs; BW = 3.4-6.6 kg
| 60 | 132 | 3.94 | 1090 | 116 | 8.1 | 4.8 |
| 80 | 176 | 4.75 | 1320 | 139 | 9.4 | 5.8 |
| 100 | 220 | 5.48 | 1520 | 173 | 11.3 | 7.7 |
| 120 | 264 | 6.19 | 1720 | 196 | 12.5 | 8.6 |
Early Lactation, Mature Ewes, Twin Lambs; Milk Yield = 1.18-2.21 kg/day
| 60 | 132 | 4.31 | 1200 | 189 | 7.3 | 6.3 |
| 80 | 176 | 5.15 | 1430 | 222 | 8.5 | 7.4 |
| 100 | 220 | 5.92 | 1640 | 253 | 9.5 | 8.5 |
| 120 | 264 | 6.63 | 1840 | 296 | 11.3 | 10.7 |
Early Lactation, Mature Ewes, Parlor Production; Milk Yield = 2.37-3.97 kg/day
| 60 | 132 | 6.14 | 1700 | 291 | 11.4 | 9.4 |
| 80 | 176 | 7.26 | 2010 | 351 | 13.8 | 12.0 |
| 100 | 220 | 8.27 | 2290 | 396 | 15.5 | 13.5 |
| 120 | 264 | 9.22 | 2560 | 438 | 17.0 | 14.9 |
Maintenance, Rams
| 100 | 220 | 3.38 | 940 | 86 | 3.3 | 3.1 |
| 125 | 275 | 4.00 | 1110 | 102 | 3.8 | 3.7 |
| 150 | 330 | 4.58 | 1270 | 118 | 4.3 | 4.3 |
| 200 | 440 | 5.69 | 1580 | 148 | 5.2 | 5.3 |
Modified from National Research Council. Nutrient requirements of small ruminants. Washington, D.C., 2007, National Academies Press.
■ TABLE 9.20
Daily Nutrient Requirements of Milk and Meat Goats
| Body Weight | Metabolizable | Total Digestible | Metabolizable | ||
| (kg) (Ib) | Energy (ME) (Mcal) | Nutrients (g) | Protein (g) | Calcium (g) | Phosphorus (g) |
Maintenance, Mature Does (Dairy/Nondairy)
| 20 | 44 | 1.13/0.96 | 310/260 | 27/24 | 1.3/1.2 | 0.9/0.8 |
| 40 | 88 | 1.91/1.61 | 530/450 | 45/41 | 1.9/1.7 | 1.5/1.3 |
| 60 | 132 | 2.58/2.18 | 720/600 | 61/55 | 2.4/2.1 | 2.0/1.7 |
| 80 | 176 | 3.2/2.7 | 890/750 | 75/68 | 2.8/2.5 | 2.4/2.0 |
Late Gestation, Mature Does (Dairy/Nondairy), Twin Kids; BW = 2.6/2.11-4.8 kg
| 20 | 44 | 1.96/1.78 | 540/490 | 70/69 | 5.0/4.9 | 2.4/2.3 |
| 40 | 88 | 3.07/2.77 | 850/770 | 111/107 | 5.8/5.6 | 3.2/3.0 |
| 60 | 132 | 4.05/3.64 | 1120/1010 | 143/139 | 6.4/6.1 | 3.7/3.5 |
| 80 | 176 | 4.93/4.43 | 1370/1230 | 172/179 | 6.9/7.2 | 4.3/4.6 |
Early Lactation, Mature Does (Dairy), Twin Kids; Milk Yield = 2.06-3.22 kg/day
| 40 | 88 | 3.77 | 1050 | 178 | 9.5 | 5.9 |
| 60 | 132 | 4.98 | 1380 | 230 | 10.3 | 6.7 |
| 80 | 176 | 6.09 | 1690 | 275 | 11.1 | 7.5 |
Early Lactation, Mature Does (Dairy), Parlor Production; Milk Yield = 5.82-8.04 kg/day
| 50 | 110 | 7.62 | 2110 | 398 | 19.7 | 11.4 |
| 70 | 154 | 9.54 | 2640 | 487 | 20.7 | 12.3 |
| 90 | 198 | 11.27 | 3130 | bgcolor=white>56621.5 | 13.1 | |
| Early Lactation, Mature Does (Nondairy), Twin Kids; Milk Yield | = 0.91-2.08 kg/day | |||||
| 20 | 44 | 1.59 | 444 | 73 | 7.6 | 4.1 |
| 40 | 88 | 2.53 | 700 | 118 | 8.6 | 5.0 |
| 60 | 132 | 3.34 | 930 | 152 | 9.2 | 5.6 |
| 80 | 176 | 4.04 | 1120 | 181 | 9.7 | 6.1 |
Maintenance, Mature Bucks (Dairy/Nondairy)
| 50 | 110 | 2.59/2.18 | 720/610 | 58/52 | 2.4/2.1 | 2.0/1.7 |
| 75 | 165 | 3.51/2.96 | 970/820 | 78/70 | 3.0/2.7 | 2.6/2.2 |
| 100 | 220 | 4.36/3.67 | 1210/1020 | 97/87 | 3.7/3.2 | 3.2/2.7 |
| 125 | 275 | 5.15/4.34 | 1430/1200 | 114/103 | 4.2/3.7 | 3.8/3.2 |
| 150 | 330 | 5.91/4.98 | 1640/1380 | 131/118 | 4.8/4.1 | 4.3/3.7 |
Prebreeding, Mature Bucks (Dairy/Nondairy)
| 50 | 110 | 2.85/2.40 | 790/670 | 63/57 | 2.6/2.2 | 2.1/1.8 |
| 75 | 165 | 3.86/3.26 | 1070/900 | 86/77 | 3.3/2.9 | 2.9/2.4 |
| 100 | 220 | 4.79/4.04 | 1330/1120 | 106/96 | 4.0/3.4 | 3.5/3.0 |
| 125 | 275 | 5.67/4.78 | 1570/1320 | 126/113 | 4.6/4.0 | 4.1/3.5 |
| 150 | 330 | 6.50/5.48 | 1800/1520 | 144/130 | 5.2/4.5 | 4.7/4.0 |
Modified from National Research Council. Nutrient requirements of small ruminants. Washington, D.C., 2007, National Academies Press.
forage, or concentrate rations (see Box 9.3). Make appropriate recommendations to optimize the ration. Determine if the patient or patients have a normal appetite. Is anorexia present? If the dietary history and analysis indicate that adequate nutrients have been steadily consumed, the search for a primary cause for the weight loss should be resumed.
5. Perform ancillary diagnostic tests.
a. If the weight loss is not related to the diet, additional diagnostic tests should be performed on the animal or on a number of animals in the herd. Possible tests include but are not limited to trace mineral analyses, ultrasound, and appropriate organ biopsy.
b. Pathologic findings of affected ruminants often provide evidence of the effects of a systemic disease or of chronic malnutrition. Ruminants with PCM exhibit serous atrophy of fat in the coronary grooves of the heart and bone marrow at necropsy. Subcutaneous, abdominal, and perirenal fat are not present.