Ultrasonography of the Ruminant Abdomen
Sebastien Buczinski
Medical indications of ultrasonography in cattle and small ruminants have expanded since the 1990s. This ancillary test can be performed at the patient's side and gives valuable information to confirm a clinical hypothesis.
As for any diagnostic test, it is important for the clinician to know what he or she is looking for before performing the procedure. The cattle abdomen is vast, and a complete abdominal screening (including reticulum, spleen, abomasum, small and large intestines, bladder, kidneys, and uterus in females or inguinal area in males) can be time consuming and not practical in field situations. Practical questions that the clinicians can have in mind when planning abdominal ultrasonography are numerous. To this author's knowledge, in dairy practice, the most common questions to be answered by this test are as follows: (1) Does the affected cow have cranial peritonitis? (2) If so, what is the main presumptive diagnosis, depending on the localization of fluid and effect on reticular motility? (3) Is the right-sided ping truly caused by abomasal dilation, or is another organ the source? (4) Where is the pyloric part of the abomasum when left displaced abomasum is suspected but no typical ping is heard? (5) Does a cow with colic (e.g., evidence of intestinal obstruction) need immediate surgery? (6) Is the right kidney involved when left kidney pyelonephritis is suspected? (7) When peritonitis is suspected because of unsuccessful blind abdominal tap, can a better spot be chosen? All these questions can be answered rapidly (in less than 15 min) with a focused ultrasonographic examinationUnits and Probes Required
The required characteristics of the ultrasound unit used for this examination depend on the size of the patient. For small calves (e.g., preweaned dairy calves weighing less than 100 kg [220 lb]) and small ruminants, a rectal linear probe (≥5 MHz) can generally be used for assessing abdominal structures and intraabdominal umbilical remnants.
For larger animals, a lower frequency probe (These biphasic contractions generally occur at the frequency of 1 per minute. Initially, a low-amplitude contraction (reticulum pushed from 5 to 10 cm deep in the abdominal cavity) is observed; then the reticulum returns to its relaxed state. Immediately after, a complete contraction (>17 to 18 cm) occurs.1 The general ultrasonographic landmarks that can be used to identify the reticulum is the musculophrenic vein, which is an anechoic tubular structure between the abdominal wall and the diaphragm (Fig. 32.100). The reticulum wall is smooth and slides easily along the abdominal wall. The honeycomb structure of the wall is occasionally observed.The main abnormality seen during reticular assessment is associated with cranial peritonitis such as in hardware disease. In these cases, heterogenic fluid accumulation between the abdominal and reticular walls is generally observed (exudate with fibrin strands or clots; Fig. 32.101). In these cases, the motility of the reticulum is most often abnormal, with decreased frequency and amplitude of contractions due to pain and adherences. Other findings associated with hardware disease are deformation of the reticular wall Fig. 32.102, increased wall thickness due to fibrin deposit, and abscessation characterized by a cavitary lesion Fig. 32.103. The foreign body cannot be imaged in most cases. Therefore the definitive diagnosis is based on clinical findings, extension of the peritonitis findings (mainly left-sided), and other imaging tools such as abdominal radiographs.
The rumen and omasum are also seen as hyperechoic thick-walled viscera, but no content is visualized. The rumen occupies most of the left abdominal cavity, whereas the omasum is observed at the visceral border of the liver. The clinical value of specifically assessing these organs remains to be determined.
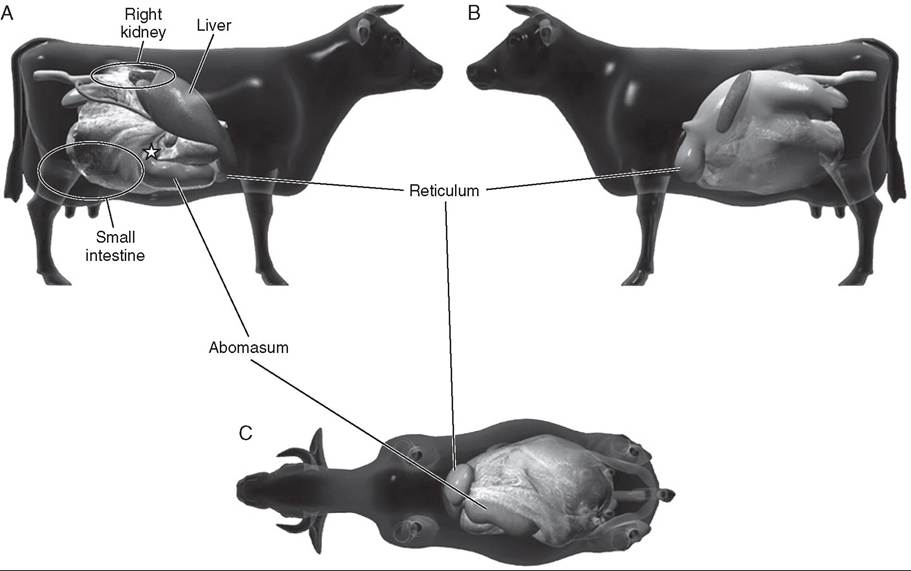
FIG.
32.96 Practical anatomic landmarks for abdominal ultrasonography in a cow. The right (A), left (B), and ventral (C) views of the abdomen. The reticulum, abomasum (and pyloric part of the abomasum [star]), liver, small intestine, and right kidney area of interest are represented in the three different views. (Courtesy Dr. Andre Desrochers and Dr. Denis Harvey, from Surgery of the abomasum in cattle, Version 2.0, Universiie de Montreal.)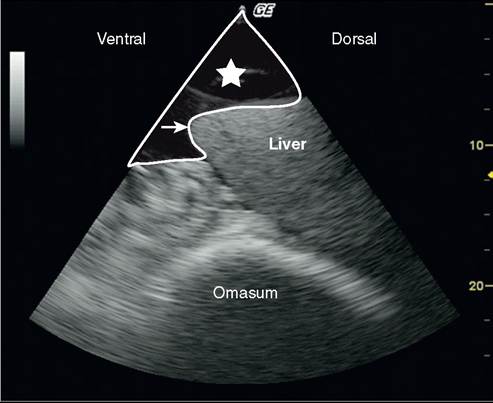
FIG. 32.97 Ascites secondary to congestive heart failure in a dairy cow. Large amounts of anechoic fluid are observed on right flank ultrasonography (star). The ventral border of the liver is also observed. The liver ventral border is not as sharp as usual because of hepatomegaly (arrow). Image obtained with a phased-array 2.5-MHz probe (maximal depth, 27 cm).
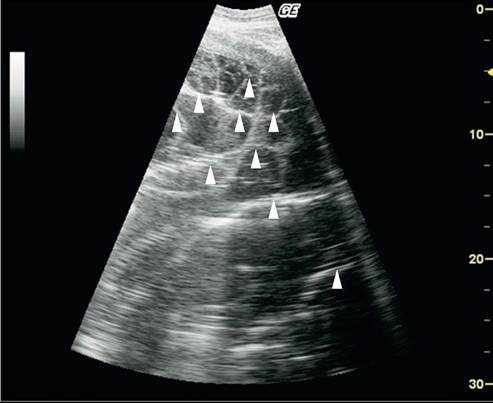
FIG. 32.98 Sonogram of caudal peritonitis in a cow secondary to uterine laceration. A large amount of peritoneal fluid is observed. The “spider-web” appearance is due to the multiple echoic fibrin strands (arrows). Image obtained with a sectorial 3.2-MHz probe (maximal depth, 30 cm).
The abomasum has a distinct ultrasonographic appearance in comparison with others. The abomasal wall is thinner and can sometimes be difficult to identify specifically with a low- frequency probe. The normal abomasum position varies greatly throughout the production phase of a dairy cow. This organ is pushed cranial to the left in late pregnancy and then is slowly displaced toward the right ventral part of the abdomen. The pyloric part of the abomasum has specific characteristics used to localize the abomasum position. This portion has a thick multilayered wall and is most often observed as a crescent shape structure oral to the cranial part of the duodenum (Fig. 32.104). The posterior (deeper) wall of the pyloric part
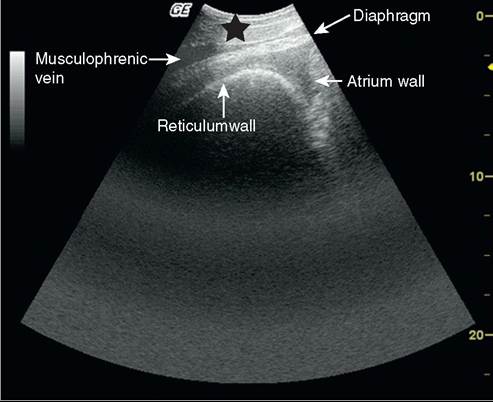
FIG.
32.100 Sonogram of the reticulum at the beginning of its first contraction. The reticulum wall is characterized by its hyperechoic aspect. Because of gas content, no forestomach content can be seen. The musculophrenic vein allows distinguishing the diaphragm and abdominal wall (black arrow). The atrium wall is partially visible. At the beginning of the first contraction of the reticulum, the space between the reticulum and the diaphragm is slightly increased in comparison with the that between contractions. Better contrast enables easier reading of the sonogram. Image obtained with a sectorial 3.2-MHz probe (maximal depth, 23 cm).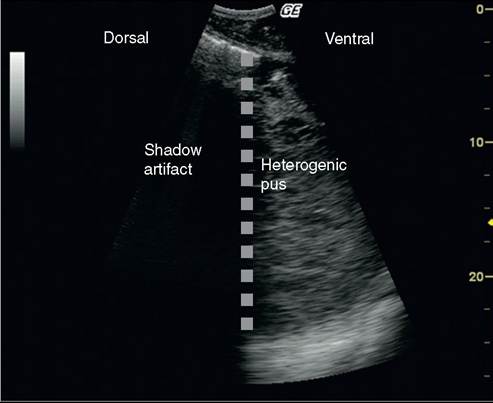
FIG. 32.99 Gas-liquid interface seen in a cow with retroperitoneal abscess secondary to right flank laparotomy. The gas-tissue interface (gray dotted line) was caused by gas-producing bacteria present in the abscess. The shadow on the dorsal part of the flank is an artifact. Heterogenic pus is visible on the ventral part of the sonogram. Image obtained with a sectorial 3.2-MHz probe (maximal depth, 28 cm).
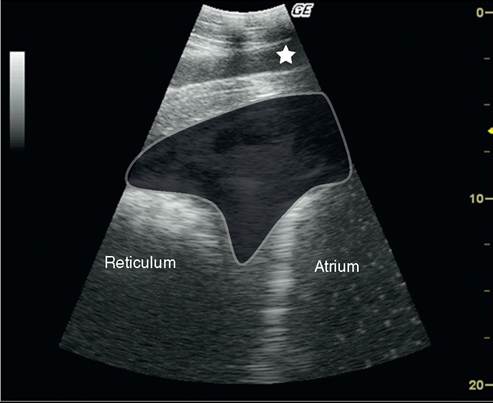
FIG. 32.101 Typical aspect of traumatic reticuloperitonitis in a dairy cow. The heterogenic peritoneal content (shaded area) between the diaphragm, reticular wall (left), and rumen atrium wall (right) is observed. The diaphragm is surrounded by the musculophrenic vein (star) and peritoneal fluid. Image obtained with a sectorial 3.2-MHz probe (maximal depth, 20 cm).
is generally not observed because of shadow artifact associated with gas content of the viscus.
Because of the difficulty in characterizing abomasal position, the pylorus position is a useful indicator of abomasal position when an abomasal displacement is suspected with no ping on auscultation or when right-sided ping indicates abomasal dilation. In these situations, the pylorus is not in its normal specific position, and secondary findings associated with abomasal dilation, such as the presence of a gas-liquid interface (on the left or right), can be observed (Fig.
32.105). When a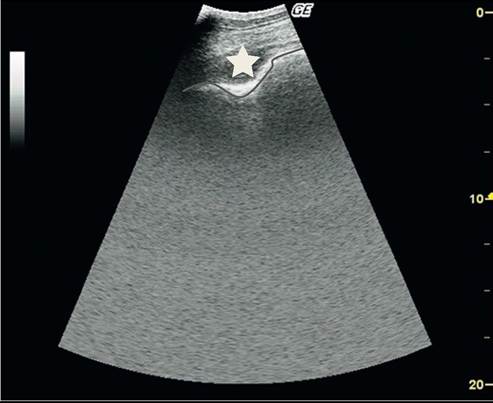
FIG. 32.102 Deformation of the reticular wall in association with hardware disease. The reticular wall (highlighted in gray) is different from its traditional smooth appearance due to the presence of peritonitis (star) and focal increased pressure. Image obtained with a sectorial 3.2-MHz probe (maximal depth, 20 cm)
“floating” displaced abomasum is suspected, the pylorus is generally found medial to the right mammary vein or close to the ventral midline. In these situations, ultrasonography may help in treatment decision. In case of abomasal dilation or volvulus of the abomasum, the distended abomasum precludes normal observation of the liver. The position of the pylorus is also interesting to distinguish abomasal dilation from volvulus because the pyloric part of the abomasum is observed more cranially in cases of volvulus. Infiltration of the abomasum by lymphomatous tissue can also be suspected when imaging the pyloric part of the abomasum (Fig. 32.106). In these conditions, transabdominal fine-needle aspiration or biopsy in the thickened wall may help determine the final diagnosis.2
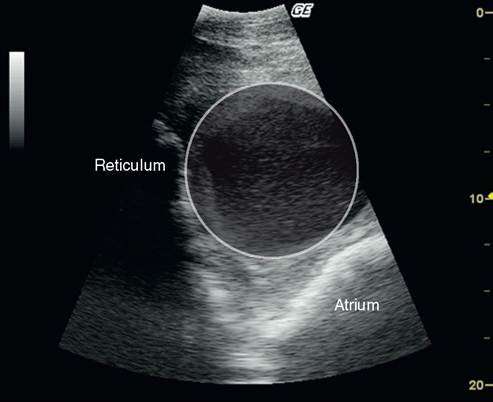
FIG. 32.103 Chronic traumatic reticuloperitonitis and abscessation. The reticulum and atrium walls are visible. The atrium is pushed dorsally because of a cavitary lesion with an heterogenic content and thick wall (abscess). Image obtained with a sectorial 3.2-MHz probe (maximal depth, 20 cm).
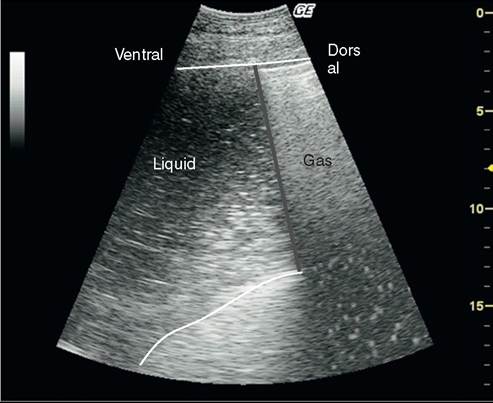
FIG. 32.105 Ultrasonographic appearance of a left displaced abomasum (or right abomasal dilation/volvulus) A gas-liquid interface is observed (gray dotted line). The abomasal wall is indicated with white lines. The medial wall cannot be observed on the dorsal part because of the presence of gas within the distended abomasum.
Image obtained with a sectorial 3.2-MHz probe (maximal depth, 19 cm).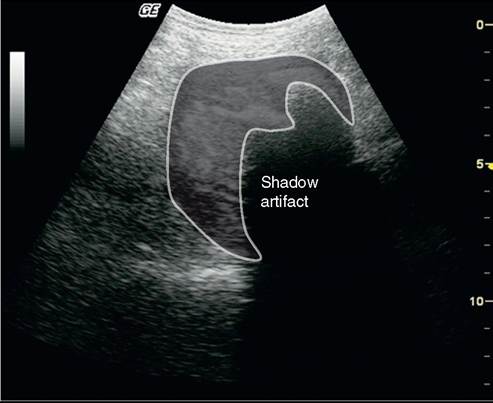
FIG. 32.104 Pyloric part of the abomasum in transverse section.
The pyloric part of the abomasum has a thick layered wall. The characteristic crescent shape is visible because of residual gas within the abomasal lumen. A shadow artifact is therefore observed. Image obtained with a sectorial 3.2-MHz probe (maximal depth, 13 cm).
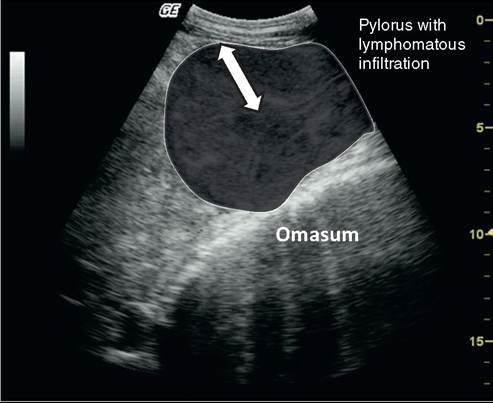
FIG. 32.106 Ultrasonographic aspect of the pyloric part of the abomasum in a cow with abomasal infiltration by lymphomatous tissue. The wall of the pyloric part is thickened (3 to 5 cm; arrows'), as is the cross-section of the pylorus (gray shaded area). The multilayered structure of the enlarged pylorus is also visible. Image obtained with a sectorial 3.2-MHz probe (maximal depth, 17 cm).
Abomasal ulcers cannot be observed with ultrasonography. Perforating ulcers can be suspected when finding images compatible with peritonitis are close to the abomasal projection area (Fig. 32.107). However, these findings are not specific and can be associated with any cause of peritonitis.3
SMALL AND LARGE INTESTINES. Ultrasonography of the small and large intestines is generally straightforward. The small intestine is generally observed in the midventral part of the right flank. Multiples loops of small intestine are observed; constant movement indicates good peristalsis. The normal diameter of the small intestine is generally less than 4 cm, but its cross-sectional dimension varies constantly. The content of small intestine is generally visible as areas of variable echogenicity (Fig. 32.108, Video 32-2).
The most common abnormal findings during small intestine ultrasonography is ileus. In these situations (either paralytic or obstructive ileus), significant distention of the small intestine loops is observed with decreased motility (Fig. 32.109, Video 32.3). Secondary peritoneal effusion can be seen in association with impaired mesenteric blood flow and transudation. Edema of the intestinal wall can also be observed (e.g., wall thickness >2 to 3 mm)3 (Fig. 32.110).
One of the main challenges during small intestine ultrasonography is to differentiate obstructive causes of ileus (i.e., necessitating surgical treatment) from medical causes. The exact cause of obstruction is rarely diagnosed on transabdominal ultrasonography because of the size of the bovine abdomen.
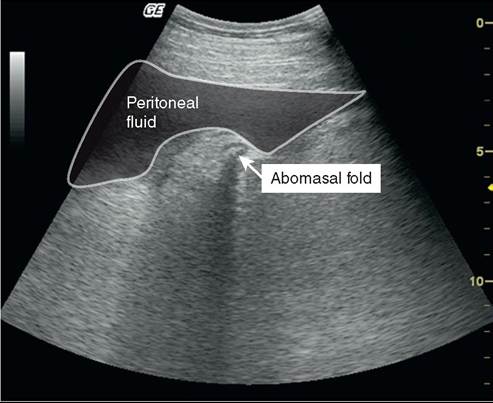
FIG. 32.107 Cranial peritonitis associated with perforating abomasal ulcer. Hypoechoic peritoneal fluid accumulation is visible close to the abomasum. The abomasum is recognized by hypoechoic abomasal fold. Abomasal ulcer was suspected because of the localization of peritonitis close to the abomasum. However, it cannot be definitively diagnosed without other ancillary testing (e.g., laparotomy or necropsy). Image obtained with a sectorial 3.2-MHz probe (maximal depth, 14 cm).
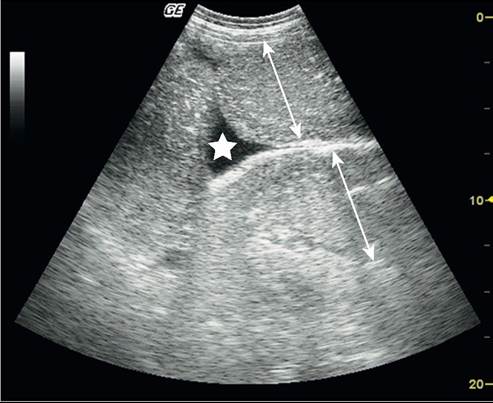
FIG. 32.109 Sonogram of obstructive ileus associated with hemorrhagic bowel syndrome. An important distention of the small intestine loops is observed (>6 to 7 cm in diameter). Secondary anechoic peritoneal effusion is also observed (star). Image obtained with a sectorial 3.2-MHz probe (maximal depth, 20 cm).
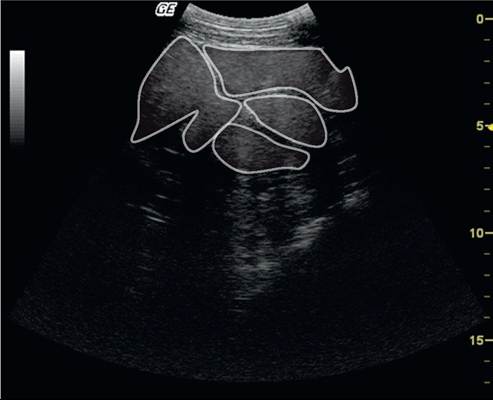
FIG. 32.108 Sonogram of normal small intestine loops in an adult Holstein cow. The intestine loops are characterized by their various shapes, hypoechoic wall, and echoic content. Their wall is delimited by a white line. When imaging is done in real time, constant movement of the loops and their content is observed. Image obtained with a sectorial 3.2-MHz probe (maximal depth, 17 cm).
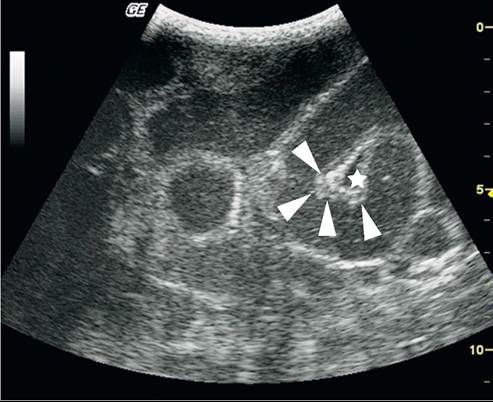
FIG. 32.110 Sonogram of obstructive ileus secondary to atresia coli in a 3-day-old Holstein calf. Besides intestinal loops dilation and peritoneal fluid accumulation (star), thickening of the intestinal wall is also observed secondary to intestine wall edema (arrowheads). Image obtained with a sectorial 3.2-MHz probe (maximal depth, 12-cm).
However, identification of indirect consequences of obstructive ileus is an achievable goal that helps in the decision of medical or surgical treatment. In cases of obstruction, the visualization of distended (oral to the obstruction) and empty loops (aboral) of small intestine helps the clinician make the decision about whether surgery can be delayed.
The large intestine can be imaged by ultrasonography on the dorsal midright flank. However, limited information can be obtained. First, its content is full of gas and cannot be imaged. Second, it is difficult to identify each part of the large intestine. The thin large intestinal wall, which is close to the probe, can be observed. A shadow artifact hides deeper parts of the large intestine. The caecum can also be imaged with ultrasonography.4 In general diagnosis of cecal problems relies on the transrectal examination findings. The general appearance of the caecum is the same as that of the large intestine (Fig. 32.111).
LIVER ULTRASONOGRAPHY. The liver can be imaged with transabdominal ultrasonography. A high-frequency probe can be used in calves, but a low-frequency probe is indicated for the assessment of the liver in adult cattle (especially if the caudal vena cava, which is located deep in the abdomen, is scanned). Prior knowledge of the liver anatomy is required, and the clinician must remember that an important part of liver parenchyma cannot be directly visualised because the diaphragmatic portion of the liver is surrounded by lung
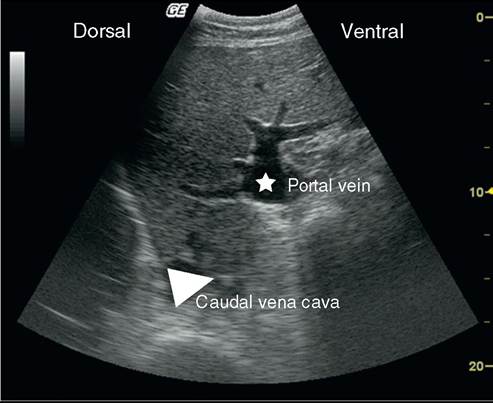
FIG. 32.112 Ultrasonogram of the liver, showing the relative position of caudal vena cava and portal vein in a Holstein heifer. The liver parenchyma has an homogenous echogenic texture. The portal vessels and major portal vein are characterized by a hyperechoic wall (star) in the midvisceral part of the liver. The caudal vena cava is visible in the dorsal and deep part of the liver as a triangular shape. Image obtained with a sectorial 3.2-MHz probe (maximal depth, 20 cm).
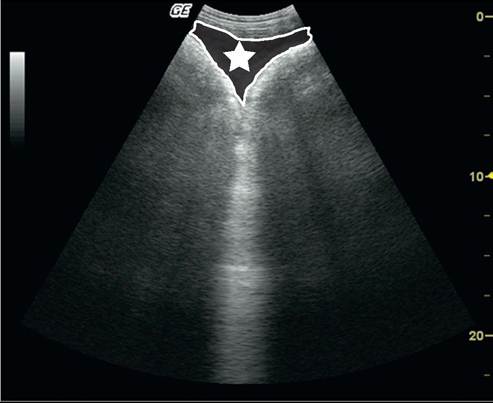
FIG. 32.111 Right flank sonogram of large intestine in a Holstein heifer with cecal dilatation and torsion. The cecal/colonic wall is visible as a thin echoic wall. Because of the gas content, no ultrasound beam is transmitted beyond the superficial wall. Secondary findings associated with peritonitis (increased peritoneal fluid with small echoic fibrin strands) are outlined (star). Image obtained with a sectorial 3.2-MHz probe (maximal depth, 25 cm).
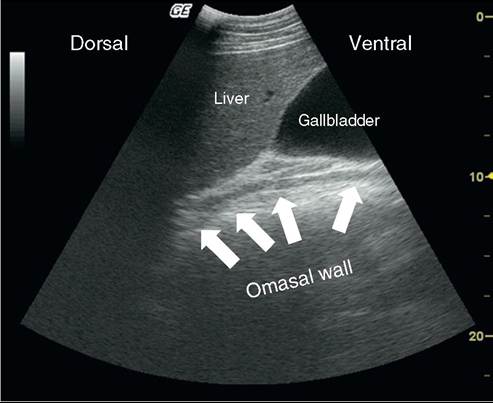
FIG. 32.113 Normal aspect of the gallbladder. The gallbladder, as observed from the ninth to eleventh intercostal spaces, appears as a pear-shaped structure with anechoic content, originating from the ventral visceral surface of the liver. Image obtained with a sectorial 3.2-MHz probe at the ninth intercostal space (maximal depth, 22 cm).
parenchyma. The screening area runs from the ventral fifth intercostal space to the last intercostal space.5
Different structures can be observed when the liver is scanned.5,6 The liver parenchyma has a hypoechoic to echoic homogenous aspect. Small anechoic structures such as vessels or biliary ducts are visible within the parenchyma. The portal vein and major portal vessels, the caudal vena cava aspect (Fig. 32.112), and the gallbladder aspect (Fig. 32.113) are also observed during the ultrasonographic examination. Basic knowledge of the normal appearance of the liver and its structures is essential when ultrasonography is used on an animal with suspected liver disease. The right and caudate lobe of the liver can be observed, but a significant portion of the left lobe is not visible because of its relative position within the lung field. Pneumoperitoneum and abomasal right dilation/volvulus are also conditions that preclude a correct visualization of the liver parenchyma.
Liver ultrasonography is especially helpful for the diagnosis of liver abscesses, caudal vena cava thrombosis, and any focal or diffuse liver changes. Ultrasonography may help the clinician select the best area to perform liver biopsy or fine-needle aspiration for a definitive diagnosis.
Liver abscessation is a common hepatic condition in calves, dairy cows, and feedlot cattle.7 The clinical signs are not specific, and liver ultrasonography is generally helpful if the affected site is not in the part of the organ beneath the lungs. Previous studies in feedlot calves have revealed the limited ability of ultrasonography to show lesions on the left hepatic lobe.8 Cavitary lesions of various size and shape can generally be observed (Fig. 32.114). The abscess content can be homogenous to heterogenous. The definitive diagnosis is made through fine-needle aspiration to differentiate from liver neoplasm or cystic structures.5 Liver neoplasms are uncommon in cattle, but the ultrasonographic aspect of hepatocellular adenoma, bile duct carcinoma, and adenocarcinoma have been reported.9 The ultrasonographic changes are not pathognomonic and generally consisted in single to multiple circular structures. The definitive diagnosis necessitates biopsy or aspiration of the abnormal area. Liver metastasis secondary to the spread of a primary non hepatic tumor (e.g., lymphoma) has also been reported.5
Liver ultrasonography is helpful for the diagnosis of liver flukes and cholestastic disorders in cattle. In cases of chronic fasciolosis, calcified bile ducts are recognized by the acoustic shadowing below the mineralized duct.10 Percutaneous puncture of the gallbladder to search for flukes' eggs is more a sensitive test than is fecal eggs testing for Fasciola hepatica and Dicrocoelia dendriticum infection.11 Distention of the biliary tract is observed with any cholestatic disease. Establishing a differential diagnosis with liver vessels is not easy without color flow Doppler imaging. Distention of the gallbladder alone is not a specific sign of liver dysfunction because dilation may occur in anorexic cows without any primary liver disease.
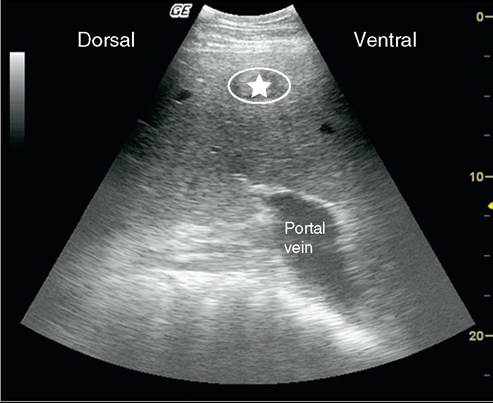
FIG. 32.114 Ultrasonographic aspect of liver abscess. The abscessation is represented by a cavitary lesion with heterogenic content (star) within liver parenchyma. Image obtained with a sectorial 3.2-MHz probe (maximal depth, 22 cm).
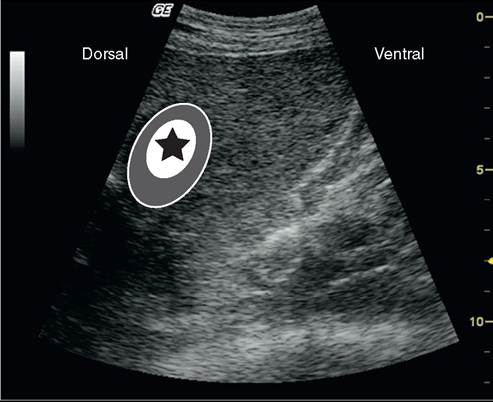
FIG. 32.115 Liver abscess secondary to omphalophlebitis in a
2-week-old Holstein calf. The abscess is characterized by a thick hypoechoic capsule (gray colored zone). The pus appears with an hyperechoic aspect (star). Image obtained with a sectorial 3.2-MHz probe (maximal depth, 15 cm).
Liver ultrasonography can also be performed for the diagnosis of fatty liver syndrome (hepatic lipidosis). This diffuse liver disease is characterized by fat accumulation within liver parenchyma. The excess of fat within the liver cells increases their impedance and therefore attenuates the ultrasonography beam more rapidly.5 Contrast in the image is decreased, which renders the quality of imaging vascular structures poor (vascular blurring). The specific diagnosis of fatty liver is difficult without software for automatic texture analysis.12,13 However, this type of digital analysis is not routinely performed in a clinical setting. The ultrasonographer is able to detect only severe liver infiltrations.
Anomalies of the liver vessels mainly consist of caudal vena cava thrombosis and liver congestion secondary to heart failure. In young calves, omphalophlebitis with or without liver abscessation is also commonly reported (Fig. 32.115).14 Caudal vena cava thrombosis is a common vascular condition in which subacute
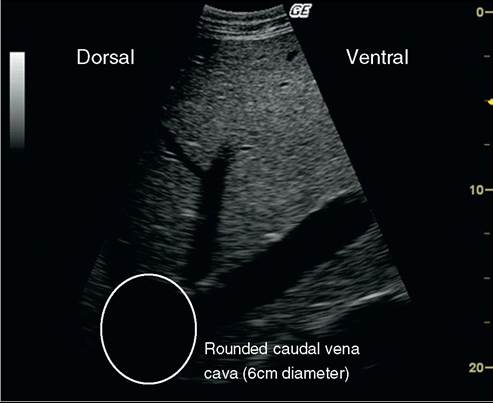
FIG. 32.116 Ultrasonographic aspect of distension of the caudal vena cava in a Holstein cow with thrombosis of the caudal vena cava. Congestion of the caudal vena cava is characterized by distention (diameter, >4.5 to 5 cm) and change of shape from triangular to circular as a result of thrombosis of the vessel. The thrombus is generally not seen because it is masked by the lung field. Image obtained with a sectorial 3.2-MHz probe (maximal depth, 20 cm).
ruminal acidosis is commonly observed (e.g., in feedlot calves and dairy cows). The thrombosed part of the caudal vena cava cannot be seen transabdominally because of interference with the lung field but can be imaged on intraabdominal ultrasonography during explorative laparotomy.15 The main anomaly observed on transabdominal ultrasonography is associated with secondary changes of the caudal vena cava shape before the thrombosed area. The increased hydrostatic pressure is associated with a dilation and a shift in the shape of the caudal vena cava from triangular to round (Fig. 32.116). The reported range of the diameter of the caudal vena cava is 2 to 5 cm, depending on the intercostal space screened.6 The portal vein normal diameter generally varies from 1.7 to 5.3 cm. All liver vasculature can be distended secondary to right-sided heart failure (Fig. 32.117). Because of hepatomegaly caused by liver congestion, the liver borders are less sharp than usual (see Fig. 32.97). In these situations, the clinical presentation typically differs from caudal vena cava thrombosis.
The pancreas can also be observed on abdominal ultraso- nography.16 However, its visualization is difficult because of its poorly defined shape and structure. Pancreatic diseases are uncommon in cattle, and little information about the use of ultrasonography to investigate pancreatic disease has been reported, except with regard to transabdominal biopsy17 and induction of experimental pancreatitis by transabdominal chloroform injection.18
KIDNEYS AND URINARY TRACT. The urinary tract can be imaged on transabdominal and transrectal ultrasonography.19 Ultrasonography can be especially helpful in the detection of pyelonephritis, hydronephrosis, and distention/rupture of the bladder secondary to urolithiasis. Infection of the urachus and umbilical arteries can also be diagnosed in calves.14
During transabdominal examination with a low-frequency probe in an adult cow, the clinician can observe most of the right kidney and occasionally part of the left kidney. In young calves, the transabdominal approach can also be used with a high-frequency probe because of the superficial position of the kidneys. The caudal part of the left kidney is traditionally imaged through a transrectal approach with a high-frequency probe.
id="Picutre 245" class="lazyload" data-src="/files/uch_group31/uch_pgroup24/uch_uch7228/image/image389.jpg">
FIG. 32.117 Liver changes secondary to right-sided heart failure. The main changes are related to liver vasculature. Dilation of the caudal vena cava (star) and the portal vein (PV) is visible, as is the general increase in the vessels’ sizes, especially in the superficial part of the liver (arrows). Images obtained with a sectorial 3.2-MHz probe (maximal depth, 22 cm).
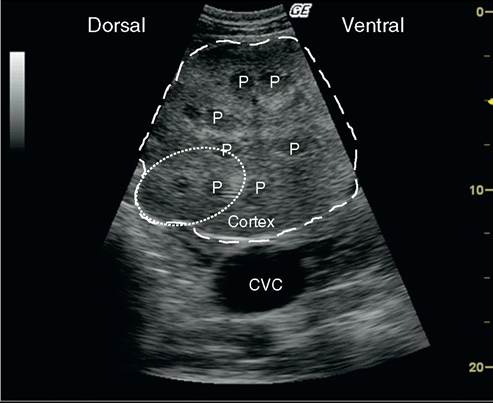
FIG. 32.118 Transverse view of the right kidney in a cow with caudal vena cava thrombosis. The lobulation of the kidney is visible (example: dotted circle). The hypoechoic pyramids (P) can be distinguished from the more echoic cortex. The distended caudal vena cava (CVC) is also seen on that image. Image obtained at the dorsal right paralumbar fossa with a sectorial 3.2-MHz probe (maximal depth, 20 cm).
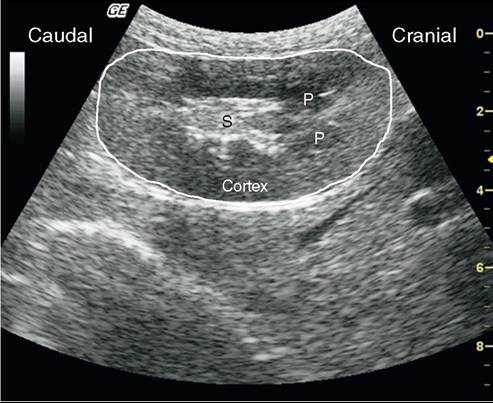
FIG. 32.119 Longitudinal view of the left right kidney in an adult Boer buck. The bean shape of the kidney is observed. The hypoechoic pyramids (P) can be distinguished from the more echoic cortex. The hyperechoic renal sinus (S) is also observed. Image obtained at the dorsal right paralumbar fossa with a sectorial 3.2-MHz probe (maximal depth, 10 cm).
Most of the right kidney is observed on the dorsal part of the paralumbar fossa and the last intercostal space (extending from the thirteenth rib to the third lumbar vertebra). Other approaches such as placing the probe between the transverse processes of the lumbar vertebrae can also be done. Visualization of the left kidney by transabdominal approach is limited because of the presence of gas-filled superficial loops of large intestine.
The normal kidney is characterized by its lobulated aspect in cattle (Fig. 32.118), which is in contrast to the bean-shaped appearance in small ruminants (Fig. 32.119). The cortex is more echogenic than the medullary pyramids. In the central part of the kidney, the renal sinus is seen as a hyperechoic structure (because of fat content; see Fig. 32.119). It is difficult to differentiate vascular and ureteral structures.
Ultrasonography can detect kidney changes associated with pyelonephritis, which is a common urinary tract disease in dairy cows. The main changes are associated with abnormal deposits in the collecting structures of the kidney (Fig. 32.120). Distention of the urethra can be distinguished from renal vessels if color-flow Doppler imaging is available (Fig. 32.121). Hydronephrosis secondary to ureteral obstruction can be observed as a dilation of collecting structures and compression of both the pyramid and cortex (Fig. 32.122). Ultrasonography is of particular interest for distinguishing unilateral from bilateral renal diseases, which is of prognostic importance. Other less important renal anomalies (nephrolithiasis or cysts; Fig. 32.123) can also be observed during the examination.
The urinary bladder can be imaged transabdominally in small ruminants and calves (Fig. 32.124) and by transrectal examination in adult cattle. The more common anomalies of urinary bladder are associated with infection (cystitis), which leads to increased urine echogenicity and heteroge- nicity. Urolithiasis-associated changes are also an indication of performing urinary bladder ultrasonography to evaluate bladder wall integrity (rupture). Severe distention is observed (see Fig. 32.124) before rupture occurs. In case of ruptured urinary bladder, the ultrasonographic findings are very similar to those of ascites or diffuse peritonitis. Analysis of fluid obtained by abdominocentesis is helpful for reaching the final diagnosis.
OTHER ABDOMINAL STRUCTURES. The genital tract (male and female), abdominal lymph nodes, and spleen can also be imaged during the ultrasonography of the abdomen. The genital anomalies are beyond the scope of this chapter. The primary
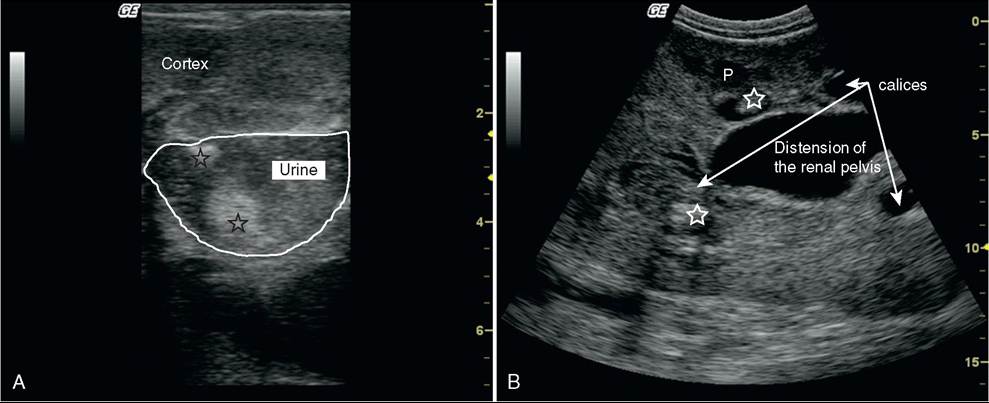
FIG. 32.120 Abnormal findings associated with pyelonephritis in dairy cows. A, Distention of calices is observed with the presence of heterogenic urine secondary to infection. Hyperechoic purulent material (star) is also observed. Image obtained transrectally at the caudal part of the left kidney with a linear 8-MHz probe (maximal depth, 8 cm). B, Long-axis view of the right kidney in a dairy cow with pyelonephritis. The main anomalies are dilations of the renal calices and pelvis. Heterogenic material is seen within the distended calices and is compatible with pus or fibrin deposits. Some pyramids (P) are visibles within the renal cortex. Image obtained at the dorsal right paralumbar fossa with a sectorial 3.2-MHz probe (maximal depth, 16 cm).
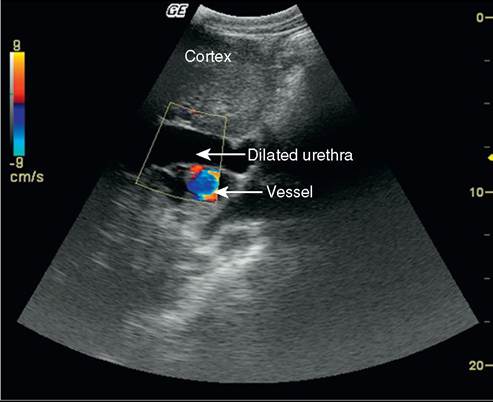
FIG. 32.121 Distinction between vessels and collecting structures in the renal sinus with color-flow Doppler imaging. Transverse view shows color in anechoic tubular structures seen within the renal sinus in the left kidney. The positive Doppler signal allows distinction between vascular structures (where Doppler signal is positive) and dilated pelvis/urethra (where Doppler signal is negative). Image obtained at the dorsal right paralumbar fossa with a sectorial 3.2-MHz probe (maximal depth, 22 cm).
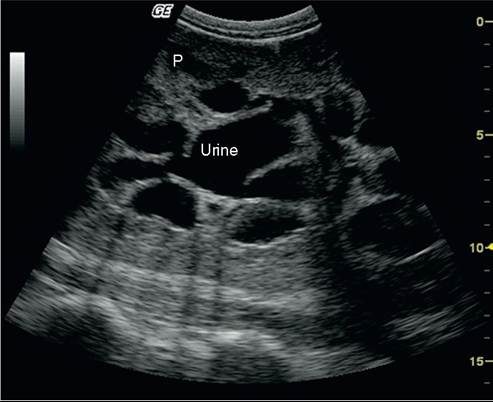
FIG. 32.122 Sonogram in a dairy cow with early-stage hydronephrosis secondary to pyelonephritis. Longitudinal section of the right kidney, showing significant dilation of collection structures (calices and pelvis), which are filled by anechoic urine. Several pyramids (P) are still visible. The renal parenchyma is compressed by urinary distention, which leads to irreversible renal failure. Images obtained at the dorsal right paralumbar fossa with a sectorial 3.2-MHz probe (maximal depth, 16 cm).
diseases of the spleen are uncommon and most of the time are caused by migration of a foreign body as a result of hardware disease. The mesenteric lymph nodes can also be observed during abdominal ultrasonography for various infectious and inflammatory conditions.