Cardiac Output and Its Regulation
Cardiac output (CO) is the volume of blood pumped by a ventricle of the heart into its vessel per unit time, and it is the product of heart rate (HR) and stroke volume (SV): CO = HR ? sV.
The values for Co refer to the output of a single ventricle, but the outputs of the right and left ventricles should be equal. The regulation of HR is via autonomic nervous system regulation of the SA node, as described earlier, and this is one means by which Co is regulated. However, SV, the other determinant of CO, is also subject to change and regulation. The two major factors that can change SV are ventricular filling and cardiac contractility.Ventricular Filling and Stroke Volume
Figure 18-6 illustrates the relation between end-diastolic volume (EDV) and the SV of the subsequent ventricular contraction. SV increases as EDV increases until an optimal EDV is reached. After that point, further increases in EDV are associated with reductions in SV. The cellular basis for this relation is not fully understood, but stretching of cardiac muscle appears to induce changes in the physical relationship between thin and thick filaments and in the affinity of regulatory proteins for calcium ions. These changes are associated with stronger contractions until the muscle is overstretched. The relation between stretching of cardiac muscle and force of contraction is known as the Frank-Starling curve or Frank-Starling law of the heart. in normal resting animals, the Frank-Starling curve is less than optimal, so increases in EDV can produce increases in SV and CO.
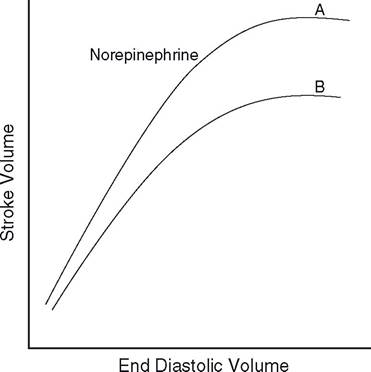
Figure 18-6. Relation between end-diastolic volume (EDV) and stroke volume (SV) in a normal heart with (A) and without (B) sympathetic stimulation.
Ventricular filling depends on filling pressure (the blood pressure in the veins and cardiac atria that force blood into the ventricles), time for filling, and ventricular compliance (the ease with which the ventricle relaxes during filling).
The filling pressure in turn depends on blood volume and constriction of the smooth muscle in veins (venoconstriction). An increase in blood volume or venoconstriction tends to increase filling pressure and EDV. Slow heart rates provide more time for filling and tend to increase EDV. Decreases in ventricular compliance tend to reduce ventricular filling, because more pressure is required to distend the ventricle during filling.The cardiac preload is the force on the heart muscle prior to contraction, and one measure of it is the amount that cardiac muscle is stretched prior to contraction. in intact animals, ventricular filling pressure and EDV are used as indicators of preload.
Cardiac Contractility and Stroke Volume
The contraction force generated by individual myocardial cells can also be changed by a mechanism that is independent of the length to which cardiac muscle is stretched prior to contraction. This phenomenon is a change in cardiac contractility; it typically results from the direct action on myocardial cells of a hormone, neurotransmitter, or drug. Agents that can elicit changes in cardiac contractility are inotropes.
Norepinephrine and epinephrine are positive inotropes, because both increase cardiac contractility. Norepinephrine and epinephrine both bind to β-adrenergic receptors on myocardial cells, and subsequent to this binding, both elicit increases in the availability of intracellular calcium in stimulated myocardial cells. The increased calcium, as well as other changes in intracellular metabolism brought about by the β-adrenergic receptor stimulation, promotes an increase in the force of contraction. other inotropes use different membrane receptors, but the intracellular events usually involve calcium availability or the affinity of intracellular proteins for calcium.
An indicator of myocardial contractility in the intact heart is the percentage of the EDV that is ejected during ventricular systole (i.e., ejection fraction). A typical value for ejection fraction in a resting animal is 40%. With sympathetic stimulation, this increases (Fig. 18-6), while with primary cardiac diseases it may reduce to 15-20%.