Electrical Dysfunctions in the Heart Cause Abnormal Patterns of Electrocardiogram Waves
Figure 20-9 is an ECG from a dog with premature ventricular contractions. This lead I strip begins with five normal beats (each QRS complex is preceded by a P wave and followed by a T wave).
The P waves are evenly spaced, with a PP interval of 0.5 second (so heart rate is 120 beats/min). After five normal beats, a large-voltage complex of abnormal shape occurs without a preceding P wave. This is indicative of a premature ven-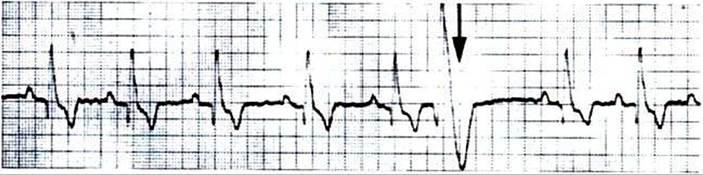
FIGURE 20-9 Lead I ECG of a dog showing five normal beats followed by one premature ventricular beat. A sixth P wave would be expected at the time marked by the arrow.This P wave is obscured by the large voltages associated with the premature ventricular beat. Also, the refractory period associated with the premature beat prevented the sixth normal ventricular beat from occurring; this creates a long pause (called the compensatory pause) between the premature beat and the next regular beat. In this and the remaining ECG examples, chart speed is 50 mm/second (10 major grid divisions equal 1 second). (From Ettinger SJ: Textbook of veterinary internal medicine, ed 3, Philadelphia, 1989, Saunders.)
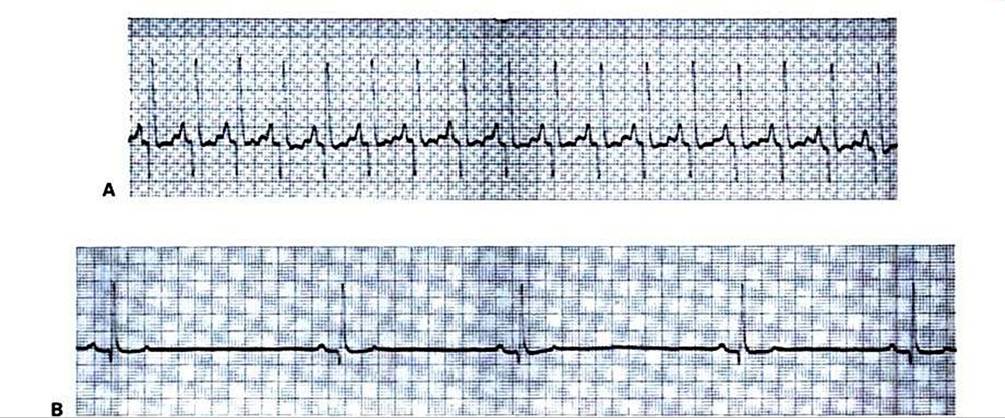
FIGURE 20-10 Sinus tachycardia (A) and sinus bradycardia (B) are evident in these otherwise-normal ECGs from two resting dogs. {From Ettinger SJ: Textbook of veterinary internal medicine, ed 3, Philadelphia, 1989, Saunders.)
tricular depolarization (atrial depolarization could not produce such large voltage deflections). The predominant voltage in the abnormal complex is positive in lead L indicating that the premature ventricular depolarization spread predominantly from right to left in the ventricles. The abnormal shape and long duration of the complex indicate that the premature depolarization did not spread across the ventricles by way of the rapidly conducting bundle branches and Purkinje fibers.
In other words» the ectopic site that originated the premature depolarization was not within the AV bundle or bundle branches. Instead, the ventricular depolarization must have spread through more slowly conducting pathways. The abnormally large T wave associated with the premature beat further emphasizes the abnormal pattern of spread of the premature action potential across the ventricles.Had the premature depolarization originated from an ectopic pacemaker within the AV bundle or bundle branches, the pattern of ventricular depolarization and the pattern of ventricular repolarization would have appeared normal; that is, the QRS complex and the T wave of the premature beat would have looked like the other QRS and T waves. They would simply have occurred earlier than expected and would not be preceded by a P wave. Sometimes, premature contractions are initiated by ectopic pacemakers in the atria. In such a case the QRS complex and T wave would be expected to have a normal size and shape because normal ventricular pathways would be involved in ventricular depolarization and repolarization.
Figure 20-10 shows additional examples of cardiac electrical dysfunctions, recorded from resting dogs. In the ECG in Figure 20-10, A, the R waves are evenly spaced and indicate a ventricular rate of 235 beats/min. This is fast for a resting dog. However, the pattern of ECG waves appears to be normal; each QRS complex is preceded by a clear, positive P wave and is followed by a positive T wave (which overlaps the next P wave). The most likely diagnosis is sinus tachycardia (rapid heart rate initiated by SA node pacemakers). Figure 20-10, B, shows the opposite extreme. Fhe pattern of ECG waves is normal, but the heart rate is only 55 beats/min. The diagnosis is sinus bradycardia (the SA node is the pacemaker, but its rate is abnormally slow).
The ECG provides an easy way to diagnose AV node block. The ECXj in Figure 20-11, A, looks normal, except that there is an abnormally long PR interval, which is indicative of abnormally slow conduction of the action potential through the AV node and AV bundle, and thus first-degree AV node block.
In Figure 20-11, B, the P wave spacing indicates an atrial rate of 123 beats/min. Four of the P waves are followed by faintly visible QRS complexes and large, negative T waves, but the other seven P waves are not followed by QRS-T complexes. Apparently some, but not all, atrial depolarizations are conducted through the AV node, which indicates a condition of second-degree AV block. The condition is not life threatening unless there are so many missed ventricular beats that cardiac output falls to dangerously low levels.Figure 20-11, C, shows third-degree (complete) AV node block (and, incidentally, ST segment depression). Two large QRS complexes are faintly visible, followed by negative T waves. The RR interval is about 2.9 seconds, indicating that the ventricular rate is only 21 beats/min. The QRS complexes are not immediately preceded by P waves. Small, evenly spaced, positive P waves are present, indicating a constant atrial rate of 142 beats/min, but there is no synchronization between the P waves and the QRS complexes. Atrial action potentials are apparently being blocked at the AV node. The ventricles are beating slowly in response to an auxiliary pacemaker in the AV node or in the bundle of His.
Figure 20-12, A, shows an ECG record of a dog that is drifting in and out of ventricular tachycardia. The first five waves are abnormally shaped ventricular complexes, indica-
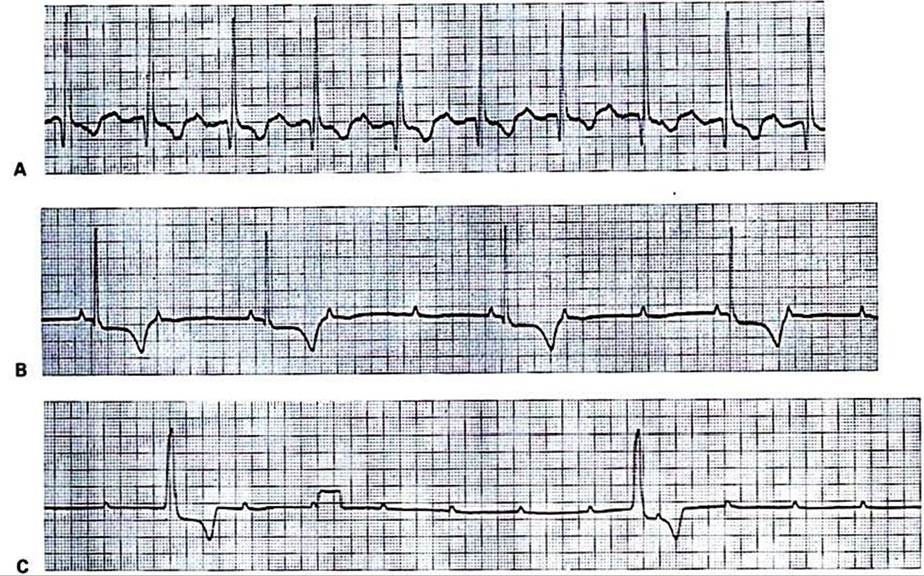
FIGURE 20-11 A, Example of first-degree AV node block (abnormally slow AV conduction). Each QRS complex is preceded by a positive P wave and followed by a negative? wave, which is normal. However, the PR interval is 0.2 second (normal for a dog is less than 0.14 second). B, Example of second-degree AV node block (sporadic AV conduction).The small, positive deflections are P waves.The broad, negative deflections areT waves, which follow the faintly visible QRS complexes. Where P waves are followed by QRS-T complexes, the PR interval is normal.
However, only every second or third P wave is followed by a QRS-T complex; that is, there are two or three atrial beats for every ventricular beat. C, Example of third-degree (complete) AV node block. Regularly spaced P waves are evident (although two of them are obscured by the two large QRS-T complexes).The QRS-T complexes are not immediately preceded by P waves. ST segment depression is also evident, but this is irrelevant to the diagnosis of AV block. The rectangular deflection one third of the way through the record is a voltage calibration signal (1 mV). (From Ettinger SJ: Textbook of veterinary internal medicine, ed 3, Philadelphia, 1989, Saunders.)tive of an ectopic ventricular pacemaker located outside the normal ventricular conduction system. No P waves are observed. Then there are three normal-appearing P-QRS-T sequences, which suggests that a normal rhythm is being established. However, the ectopic ventricular pacemaker usurps control again, and ventricular tachycardia returns.
Ventricular tachycardia degenerates frequently into ventricular fibrillation. The ECG in Figure 20-12, B, indicates ventricular fibrillation. The record shows fairly large, irregular voltage fluctuations with no discernible pattern. The atria may or may not be fibrillating; regularly occurring P waves may be present but obscured by the random electrical activity in the ventricles. However, ventricular fibrillation stops the heart from pumping blood, regardless of whether the atria continue to contract in a synchronized manner.
Atrial fibrillation, as with ventricular fibrillation, typically produces random voltage dipoles. However, because the atrial muscle mass is relatively small, the ECG voltages generated by atrial fibrillation are always much smaller than those seen in Figure 20-12, B. An ECG from an animal with atrial fibrillation would typically show normally shaped QRS and T waves against a background of low-amplitude voltage fluctuations created by the fibrillating atria.
In such a case the AV node is bombarded with very frequent action potentials from the fibrillating atria. Some of these action potentials are conducted to the ventricles, and others are blocked (the long refractory period of the AV node allows it to protect the ventricles from beating too rapidly). Thus, in the case of atrial fibrillation, the QRS-T complexes would typically have normal shape but irregular spacing in time.Sophisticated techniques are widely used in the analysis of ECGs both in human medicine and in many veterinary clinics. The purpose in this chapter is to introduce only enough complexity to illustrate the usefulness of the ECG in the diagnosis of cardiac abnormalities. In addition, this discussion of the ECG is intended to reinforce the student’s under-
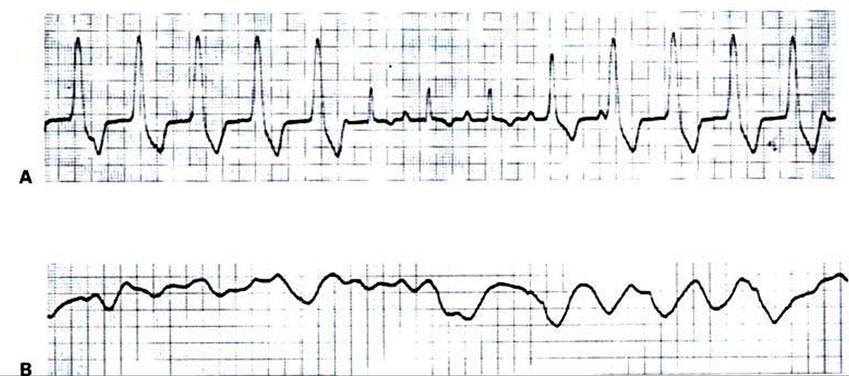
FIGURE 20-12 A, Example of ventricular tachycardia, which reverts briefly to a sinus rhythm.The ventricular rate is about 165 beats per minute.This pattern would be typical for a dog with an ectopic ventricular pacemaker functioning at almost the same rate as the SA node pacemaker; some ventricular beats would be initiated by the ectopic pacemaker, and others would be initiated in the normal way through the AV node.
B, Example of ventricular fibrillation.The random voltage fluctuations generated by the fibrillating ventricles would obscure any P waves that might be present, so it is not possible to determine whether the atria are also fibrillating. (From Ettinger SJ: Textbook of veterinary internal medicine, ed 3, Philadelphia, 1989, Saunders.)
standing of electrical dysfunction of the heart, as presented in Chapter 19.