AbnormalVoltages in the Electrocardiogram Are Indicative of Cardiac Structural or Electrical Abnormalities
The ECG in Figure 20-7 was obtained from a dog with right ventricular hypertrophy. Note that the sequence of waves in the ECG appears to be normal; that is, each heartbeat begins with an upward-going P wave, which is followed by a QRS complex and a T wave (which happens to be positive in this dog).
The atrial and ventricular rates are equal, at about 100 beats per minute (beats/min). An abnormality is evident, however, because the predominant polarity of the QRS complex recorded from lead I is negative. As mentioned, the QRS complex is caused by ventricular depolarization, and its dominant feature is normally a large, positive R wave. The R wave is normally positive as recorded from lead I, because the cardiac axis is normally angled to the left side of the thorax and because the left ventricular wall is much more massive than the right ventricular wall. Therefore, reversal of this polarity suggests that the cardiac axis has shifted to the right, that the mass of the right ventricle has dramatically increased, or both. The abnormally high voltages of the QRS complex recorded from leads Il and 111 are indicative of ventricular hypertrophy. The pronounced negative components in the QRS complexes recorded from leads II and Ill suggest that during part of ventricular depolarization, the predominant direction of depolarization is away from the left hind limb. This is consistent with a cardiac axis shifted to the right and a massive right ventricle. Substantial right ventricular hypertrophy is a common consequence of cardiac defects that increase the pressure that must be generated within the right ventricle during its contractions. Examples include pulmonic stenosis, patent ductus arteriosus, and ventricular septal defect (see Chapter 21).Sometimes, ECG voltages are abnormally low. One common cause of low-voltage ECGs is an accumulation of fluid in the pericardium.
This condition is called cardiac tamponade. In a sense the pericardial Iluid creates a short circuit for the ionic currents that would ordinarily flow outward toward the body surface. Therefore, voltages smaller than normal are created at the body surface.An upward or downward shift of the ST segment, compared with the rest of the ECG, is often indicative of an area of ischemic or infarcted ventricular muscle. Typically, ischemic or infarcted ventricular muscle cells cannot maintain a normal, negative resting membrane potential; these cells are always more or less depolarized. Therefore, in between ventricular contractions, when normal ventricular cells are at a normal resting membrane potential, a voltage difference exists between the normal and ischemic (or infarcted) ventricular cells. This voltage difference creates an electrical dipole between normal, resting ventricular muscle and ischemic (or infarcted) ventricular muscle. Figure 20-8 (bottom left) shows the orientation of this dipole for the case of an ischemic area in the inferior (caudal) part of the ventricles. The dipole creates a negative voltage in lead II during ventricular rest (i.e., during the TP segment). When an action potential enters this ventricle, the normal ventricular tissue becomes depolarized, and a QRS complex is observed. The ischemic area cannot form action potentials; it simply remains depolarized. As a result, during the ST segment, the entire ventricle, normal and ischemic, is depolarized (Figure 20-8, bottom right). During the ST segment, there is no voltage difference (no dipole) between the injured area and the normal area. With no dipole present, the ECG voltage during the ST segment is close to a true zero level. However, the ST segment is elevated in relation to the more negative voltage during the TP segment (ventricular rest). Thus, ST segment elevation (which is actually “TP segment depression”) is indicative of an ischemic or infarcted area in the inferior (caudal) part of the ventricle.
Ischemia or infarction in the anterior (cranial) ventricular area would cause ST segment depression.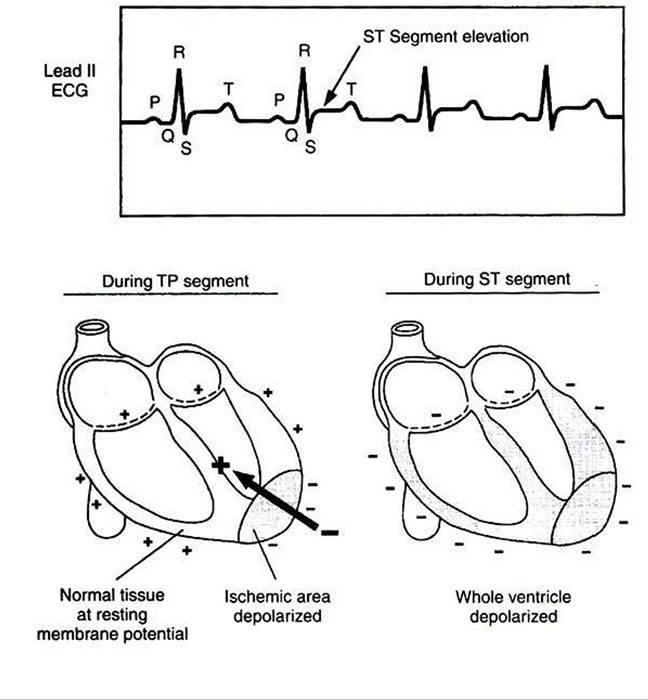
FIGURE 20-8 Voltage recorded during the ST segment is elevated compared with the baseline (TP segment) in this lead Il ECG from a dog with an inferior (caudal) ventricular infarction.The drawings show why an ischemic or infarcted area of ventricle creates a net electrical dipole in the resting ventricle (duringTP segment) but not in the depolarized ventricle (during ST segment).
Making a diagnosis solely on the basis of abnormal ECG voltage is risky. Theoretically, if the structural and electrical properties of a particular heart are known in detail, the appearance of the ECG can be predicted with certainty. However, the reverse situation is not strictly true. Several different cardiac defects may result in similar voltage abnormalities. Thus a voltage abnormality in an ECG cannot be ascribed with certainty to a particular cardiac defect. However, in conjunction with other clinical data (e.g., thoracic radiographs), ECG abnormalities are often strongly indicative of specific structural or electrical abnormalities in the heart.