An Electrocardiogram Is Simply a Graph, Made by a Voltmeter That Is Equipped to PIotVoItage as a Function of Time
The electrocardiogram (ECG) is the most frequently used clinical tool for diagnosing electrical dysfunctions of the heart. In its most common application, two or more metal electrodes are applied to the skin surface, and the voltages recorded by the electrodes are displayed on a video screen or drawn onto a paper strip.
How the heart produces voltages that are detectable at the body surface is extraordinarily complex. However, elementary physical principles can be used to develop an intuitive model of how electrocardiography works; this intuitive model is adequate for most clinical applications.An intuitive understanding of the ECG begins with the concept of an electrical dipole in a conductive medium (Figure 20-1). A dipole is a pair of electrical charges (a positive charge and a negative charge) separated by a distance. A common flashlight battery is a good example of a dipole. A battery has a positive end (where excess positive charges exist) and a negative end (where excess negative charges exist), and the two ends are separated by a distance. Ifsuch a dipole is placed within a conductive medium (e.g., bowl containing sodium chloride [ NaCl] solution), ionic currents will flow through the solution. Positive ions in the solution flow toward the negative end of the dipole, and vice versa. The flow of ions creates voltage differences within the salt solution. These voltage differences can be detected by placing the electrodes of a simple voltmeter at the perimeter of the salt solution. In Figure 20-1 an electrode placed at point A is closer to the positive end of the dipole, and an electrode at point B is closer to the negative end of the dipole. Therefore the voltage at point A will be positive in comparison with the voltage at point B. The voltmeter would detect a positive voltage difference between point A and point B. Using “V” as an abbreviation for voltage, we would summarize this condition
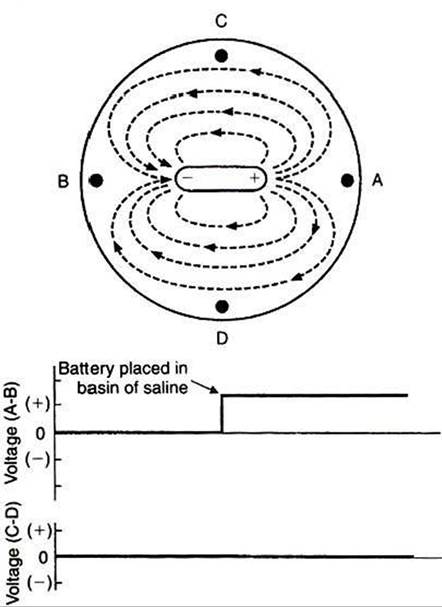
FIGURE 20-1 When an electrical dipole (e.g., a flashlight battery) is placed into a conductive medium (e.g., sodium chloride solution), the flow of ionic currents creates voltage differences within the medium.
A simple voltmeter can be used to detect these voltage differences, as shown in the lower graphs. In this example the ionic currents would create a positive voltage at point A compared with point B (i.e., voltage A-B is positive). No voltage difference exists between point C and point D (i.e., voltage C-D is zero).by saying, uVa.b is positive? Point C and point D are equally near the positive and negative ends of the dipole, so no voltage difference would exist between electrodes placed at points C and D. We would say, uVc.1, is zero?
In Figure 20-2 the battery in the NaCl solution has been replaced with an elongated strip of cardiac muscle. Again, a voltmeter is set up to detect any voltage differences that are created at point A compared with point B, and at point C compared with point D. The voltage differences (A-B and C-D) are plotted for five different conditions. In condition /, all the cells in the strip of cardiac muscle are at a resting membrane potential; each cell is charged negatively on its inside and positively on its outside. Because cardiac cells are electrically interconnected by gap junctions, the strip of cardiac muscle behaves electrically as if it were one large cell (a functional syncytium). From the outside, the strip of cells uIooks like” one large cell that is symmetrically charged positively around its perimeter. Therefore, no dipole exists. There would be no voltage difference between point A and point B (i.e., Va.b would be zero). There would also be no voltage difference between point C and point D (i.e., Vc.∣> would also be zero).
In condition 2 a pacemaker cell at the left end of the muscle strip has depolarized to threshold level and formed an action
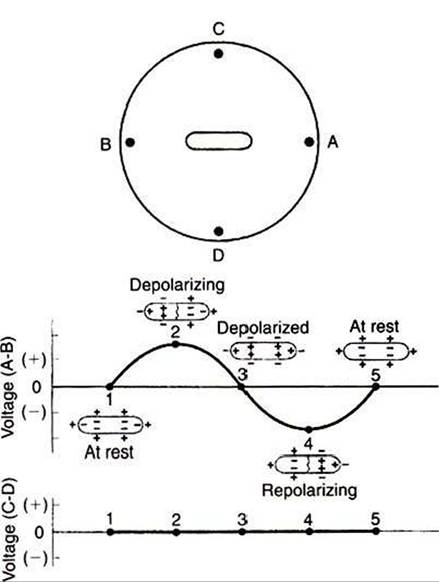
FIGURE 20-2 Strip of cardiac muscle cells in sodium chloride solution produces voltage differences between point A and point Bduring a phase of spreading depolarization or spreading repolarization, but not when all the cells are in a uniform state of polarization (i.e., not when all the cells are at rest or when all the cells are depolarized).
No voltage difference is created between point C and point D. See text for a complete description.potential. The action potential is propagating from cell to cell, through the muscle strip, from left to right. In other words, the cells at the left end of the strip are depolarized and are at the plateau of their action potential, whereas the cells at the right end of the strip are still at a resting membrane potential. Under these conditions the muscle strip forms an electrical dipole, in which the outside of the cells is charged positively at the right end and negatively at the left end. Therefore a positive voltage would exist at point A compared with point B. Note, however, that the voltage at point C compared with point D would still be zero, because neither of these points is closer to the positive end of the dipole. Therefore the graphs show that Vλ.b is positive at this time, and Vc.d is zero.
In condition 3 the entire muscle strip is depolarized; that is, all the cells are at the plateau of their action potential, with a uniform negative charge outside of each cell. Therefore, no voltage differences exist around the perimeter of the muscle strip, and the recorded voltages (A-B and C-D) are both zero.
In condition 4 the muscle strip is repolarizing; cells at the left end have returned to a resting state, whereas cells at the right end are still at the plateau of their action potential. Under these conditions the voltage at point A is negative compared with point B, because the outside of the muscle strip is charged negatively at its right end and positively at its left end (Va.b is negative). V(.p is still zero.
Table 20-1
Sign (Polarity) OfVoItages Created at Point A Compared with Point B (VA.B)[†]
Depolarization Repolarization
Approaching A +
Going away from A - +
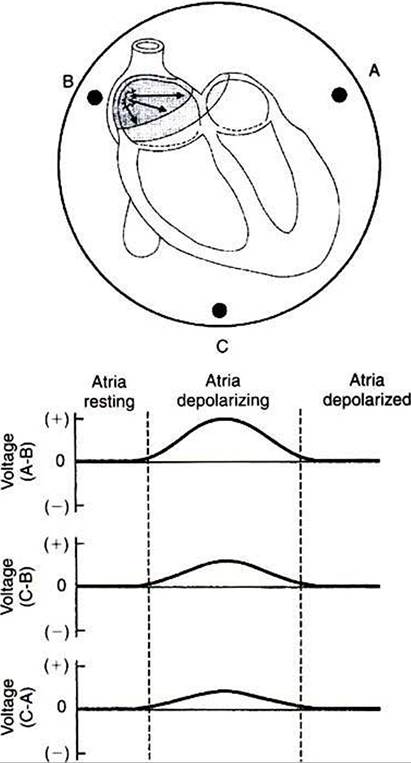
FIGURE 20-3 A resting heart, placed in sodium chloride solution, would not create voltage differences among electrodes At Bt and C. However, during depolarization of the atria, a positive voltage would be created at point A compared with point B. There would also be positive voltages at point C compared with point B and at point C compared with point A.
Once the atria are completely depolarized (with every atrial cell at the plateau of its action potential), the voltage differences between all points return to zero.