Atrial Depolarization, Ventricular Depolarization, and Ventricular Repolarization Cause Characteristic Voitage Deflections in the Electrocardiogram
In Figure 20-4 the heart is pictured in its normal position in the thorax of a dog. The extracellular fluids of the body contain NaCI in solution, so the body can be imagined as a substitute for the bowl of saline shown in the previous figures.
The positions of the left forelimb, right forelimb, and left hind limb in Figure 20-4 correspond with points A, B, and C in Figure 20-3. Figure 20-4, A, shows that, while atrial depolarization is in progress at the beginning of a heart beat, there would be a positive voltage in the left forelimb compared with the right forelimb. This is simply a repetition of the idea illustrated in Figure 20-3, the left forelimb being equivalent to point A and the right forelimb equivalent to point B.The deflection in the ECG trace during atrial depolarization is called the P wave. At the end of atrial depolarization (i.e., at the end of the P wave), the ECG voltage returns to zero. At this moment during the actual cardiac cycle, the action potential is propagating slowly, from cel) to cell, through the atrioventricular (AV) node and the first part of the AV bundle. These tissues are so small that their depolarization generally does not create a voltage difference that is detectable at the body surface.
The next voltage differences that are detectable at the body surface are those associated with the depolarization of the ventricles. The first part of ventricular depolarization usually involves a depolarization that spreads from left to right across the interventricular septum, as shown in Figure 20-4, B. This first phase of ventricular depolarization usually causes a small voltage difference (Q wave) between the left forelimb and the right forelimb, with the left forelimb being slightly negative compared with the right.
The next event in ventricular depolarization usually causes a large, positive voltage (R wave) at the left forelimb compared
with the right, as depicted in Figure 20-4, C.
To understand why this R wave is large and positive, recall that during ventricular depolarization, the left and right bundle branches conduct the spreading action potential to the ventricular apex. From there, Purkinje fibers carry the action potential rapidly up the inside walls of both ventricles. From there, the depolarization spreads from cell to cell, outward through the walls of both ventricles, as pictured by the small arrows in Figure 20-4, C. Each small arrow can be considered a dipole, with its positive end pointing toward the outside wall of the ventricle (because the inside surfaces of each ventricle depolarize before the outside surface). The net electrical effect of depolarizations spreading outward through the walls of both ventricles is a large electrical dipole pointed diagonally downward (caudad) and toward the dog’s left. This net dipole is depicted by the bold arrow in Figure 20-4, C. The net dipole points toward the left for two reasons. First, the cardiac axis is tilted toward the left (i.e., the normal orientation of the heart is with the ventricular apex angled toward the left wall of the thorax). Second, the left ventricle is much more massive than the right ventricle, so the dipoles created by depolarizations spreading outward in the massive wall of the left ventricle dominate electrically over the dipoles created by depolarizations spreading outward in the thinner wall of the right ventricle. The net result is a large» positive voltage (R wave) at the left forelimb compared with the right. The R wave is the predominant feature of a normal ECG. Abnormalities in the magnitude or polarity of the R wave have great diagnostic significance» as explained later.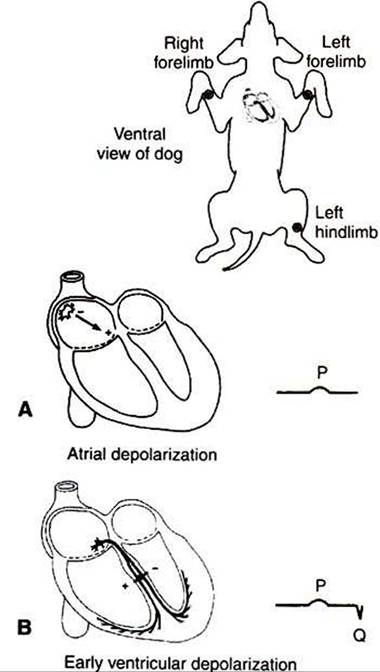
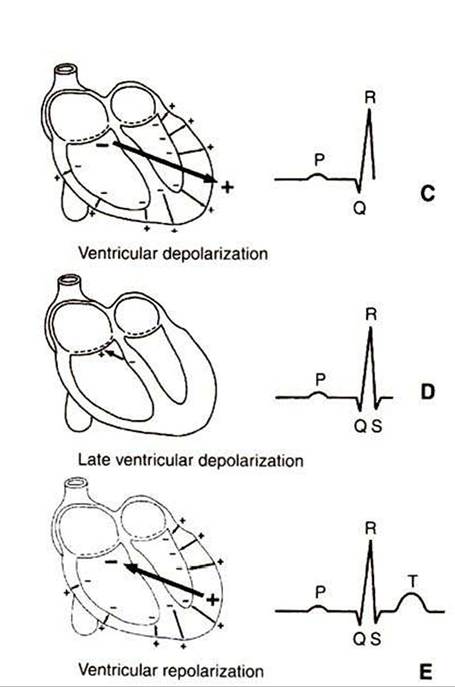
FIGURE 20-4 As a normal cardiac action potential is conducted through the atria and ventricles, a characteristic sequence of voltage differences is created between the left forelimb (analogous to point A in Figure 20-3) and the right forelimb (analogous to point B in Figure 20-3).
See text for a complete description.As the depolarizations finish spreading outward through the walls of both ventricles, the voltage in the left forelimb compared with the right forelimb returns to zero and then often becomes slightly negative for a few milliseconds (as pictured in Figure 20-4, I)). The physical basis of this small, negative S wave is obscure. After the S wave, the voltage in the left forelimb compared with the right forelimb returns to zero and stays there for a time, because all the cells throughout both ventricles are uniformly at the plateau of their action potential; no dipole exists.
Altogether, the process of ventricular depolarization produces a pattern of voltages in the ECG called the QRS wave (or QRS complex). The important feature to understand about the QRS complex is why its predominant component, the R wave, is normally large and positive. Figure 20-4, Et shows the electrical events during repolarization of the ventricles. Whereas the wave of depolarization spreads outward through the walls of both ventricles, the pattern of repolarization is not as predictable. As pictured in Figure 20-4, Et the repolarization is spreading inward through the walls of both ventricles; that is, the outside surface of the ventricles was the last ventricular tissue to depolarize but the first to repolarize. The inwardgoing repolarization creates dipoles, as depicted by the small arrows in Figure 20-4, Et with their negative end pointed toward the inside surface of both ventricles. The net dipole during this repolarization has its negative end pointed upward (craniad) and toward the dog’s right, as depicted by the bold arrow in Figure 20-4, E. This net dipole would create a positive voltage in the left forelimb compared with the right forelimb (T wave). In many normal dogs, however, ventricular repolarization proceeds in the same direction as the depolarization (from inside the ventricles to outside). This pattern of repolarization creates a negative voltage in the left forelimb compared with the right forelimb; that is, the T wave is negative. Whether positive or negative, T waves are caused by repolarization of the ventricles.
To summarize, the P wave is caused by atrial depolarization, the QRS complex by ventricular depolarization, and the T wave by ventricular repolarization. The pattern of ventricular repolarization varies from dog to dog; the T wave may be positive or negative. No identifiable wave in the normal ECG corresponds to atrial repolarization, because atrial repolarization does not proceed in an orderly enough pattern or direction to create a significant net electrical dipole.