ELECTROCARDIOGRAM1
1. What is the ECG? What are the wave forms associated with one cardiac cycle? What phase of electrical activity is associated with each wave form?
2. How are amplitudes of waves and intervals between waves measured?
When impulse conduction was explained for nerve and muscle fibers (see Chapter 4), it was noted that voltage changes occur across the nerve and muscle membranes during waves of depolarization and repolarization.
The changes are relatively small and are measured in millivolts. Similar voltage changes occur when heart muscle depolarizes and repolarizes. Voltage changes that occur locally are conducted through the body fluids because body fluids are good conductors. With appropriate amplification, these voltage changes can be recorded as they occur.S ∖
.Go to___________________________ to view a related video.
Wave Forms
Connection of the amplifier with wires (known,as leads) to selected body parts (usually the limbs) and to a recorder provides a characteristic wave form. The wave form is a recording of the electrical activity of the heart. Because the electrical activity can be changed by alterations in the heart, muscle, such as thickening of the chamber walls or interruptions of current flow caused by damaged muscle, it is useful for studying heart activity in conditions of health and disease. The wave form recording is the ECG. Several leads and their characteristic wave forms are shown for the dog in Figure Q-24. The ECG for each cycle of the heart has characteristic deflections associated with the depolarization and repolarization of the atria and ventricles as they occur in sequence. An ECG recording, such as that which might be obtained from lead II in the dog, is shown in Figure Q-25. The sequence of deflections and the activity associated with them are as follows:
1. The P wave is associated with depolarization of atria; after depolarization, atrial contraction occurs.
2. The QRS wave complex represents both positive (upward) and negative (downward) deflections associated with ventricular depolarization; ventricular contraction begins after depolarization of fibers.
3. The T wave is the last wave for each heartbeat; it represents ventricular repolarization (may be positive or negative).
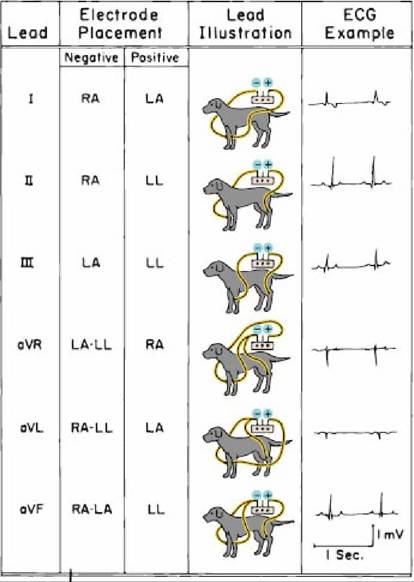
■ FIGURE 9-24 Examples of different electrode placements (leads) and their characteristic wave forms for the dog. (From Breazile JE. Textbook of Veterinary Physiology. Philadelphia, PA: Lea & Febiger, 1971.)
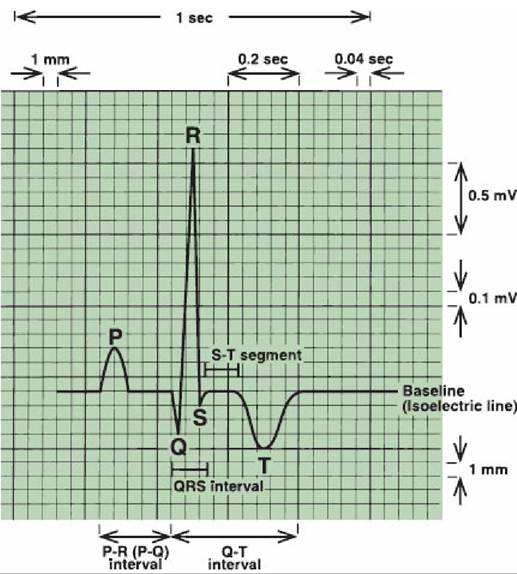
■ FIGURE 9-25 Close-up of normal canine lead II P-QRS-T complex. Measurements for amplitude (in millivolts) are indicated by positive and negative movement; time intervals (in hundredths of a second) are indicated from left to right. There is much variation in T wave configuration, which is shown as negative in this illustration. Paper speed, 25 mm/s; 1 cm = 1 mV. (Modified from Tilley LP. Essentials of Canine and Feline Electrocardiography. 3rd edn. Philadelphia, PA: Lea & Febiger, 1992.)
Because repolarization of the atria occurs during depolarization of the ventricles, a separate wave form is not observed. Instead, the voltage changes of atrial repolarization are algebraically summed into the QRS complex.
It should now be apparent why conduction of the impulse throughout each atrial and ventricular syncytium takes place rapidly. Impulse conduction results in depolarization, which must occur before contraction proceeds. Coordinated contraction of all the muscle fibers, therefore, requires near-simultaneous depolarization.
Isoelectric Line
When viewing an ECG, it can be seen that deflections of the waves, whether positive (upward) or negative (downward), commence from a common line, known as the isoelectric line. Deviations from the line represent the amplitude of the wave; it is measured in millivolts and can be positive or negative. The interval between waves is measured in hundredths of a second (see Figure Q-25). Hypertrophy of ventricular muscle might require a greater time for depolarization, and the QRS interval (time for depolarization) would be increased. Certain heart conditions can cause the interval segment to be depressed from the isoelectric line. An S-T segment depression is observed with hypoxia (lack of oxygen) of heart muscle.
■