Membrane Calcium Channels Play a Special Role in Cardiac Muscle
Figure 19-5 depicts a cardiac muscle cell action potential and the sequence of changes in K', Na+, and Ca2+ permeability that are responsible for the action potential.
As the time line begins (on the left side of each graph), the cardiac cell is at a normal, negative resting membrane potential of about -80 mV. The cardiac membrane potential is negative at rest for the same reason that skeletal muscle cells have negative resting membrane potentials: many K* channels are open at rest, and most of the Na+ channels are closed. As a result, membrane permeability to K+ is much higher than membrane permeability to Na+ (see Figure 19-5, middle two graphs). In resting cardiac cells, the membrane Ca2+ channels are closed, so Ca2 permeability is very low (see Figure 19-5, bottom); extracellular Ca2+ ions are prevented from entering the cardiac cells.As in skeletal muscle, a cardiac action potential is created when the cell is depolarized to the threshold voltage for opening the voltage-gated Na’ channels. The rapid influx of extracellular Na4 into the cell causes the cell membrane to become positively charged on its inside surface {phase O in Figure 19-5, top). The Na+ channels inactivate very quickly, and the membrane begins to repolarize (phase /). However, in cardiac muscle, repolarization is interrupted, and there is a prolonged plateau of depolarization, which lasts about 200 msec (phase 2). The plateau of the cardiac action potential is brought about by two conditions that do not occur in nerves or skeletal muscle fibers: (1) some K' channels close, so K+ permeability decreases, and (2) many of the Ca2' channels open, so Ca2+ permeability increases. Because the Ca2" concen-
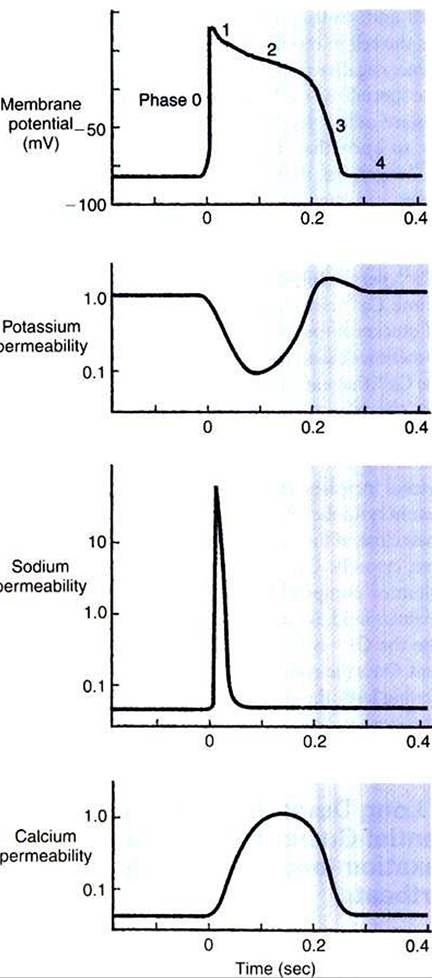
FIGURE 19-5 Membrane potential of a cardiac muscle cell (top) is determined by the relative permeabilities of the cell membrane to K+ (second from top), Na’ (second from bottom), and Ca2* (bottom).
At rest (left side of graphs), the cell is much more permeable to K’ than to Na’ or Ca2+. A cardiac action potential (middle of graphs) is produced by a characteristic sequence of changes in the permeabilities to K+, Na*, and Ca2+.The action potential ends when the permeabilities return to their resting state (right side of graphs). Phases 0 to 4 are discussed in the text.Iration is higher in the extracellular fluid than in the intracellular fluid, Ca2+ flows through the open Ca2* channels and into the cytosol. The combination of reducing the exit of K+ from the cell and allowing the entrance of Ca2' into the cell keeps the cell membrane in a depolarized state. After about 200 msec, the K' channels reopen, and the Ca2+ channels close; K' permeability increases, and Ca2' permeability decreases. The combination of increasing the exit of K+ from
the cell and shutting off the entrance of Ca2+ into the cell causes the cell to repolarize (phase 3) and eventually to reach its stable, negative resting membrane potential (phase 4).
The specialized Ca2, channels in cardiac muscle cell membranes are called slow Ca2* channels because they take much longer to open than the Na+ channels, and they stay open much longer. As shown in Figure 19-5, Na, permeability increases and then decreases (Na' channels open and then inactivate) within a few milliseconds. Ca2+ permeability, in comparison, is slow to increase (Ca2+ channels are slow to open) and Ca2+ permeability remains elevated for about 200 msec (the time Ca2+ channels stay open). In recognition of their much quicker responses, the Na* channels in cardiac muscle are sometimes called fast Na' channels.
The Ca2+ that enters a cardiac cell during an action potential triggers the release of additional Ca2+ from the sarcoplasmic reticulum.
This process is called calcium~triggered calcium release. In less than 0.1 second, the concentration of free Ca^+ in the cytosol increases about 100-fold. As in skeletal muscle, this increase in cytosolic Ca2' initiates concentration. When the Ca2+ channelsclose, at the conclusion of the action potential, most of the free, cytosolic Ca2' is pumped back into the sarcoplasmic reticulum or pumped back across the cell membrane into the extracellular fluid. Both these processes involve active transport, because the Ca2+ is being pumped against its electrochemical gradient. Once the cytosolic Ca2+ concentration is returned to its low, resting level, the cardiac muscle relaxes. Figure 19-6 shows the relationship between action potentials and the resulting contractions in a cardiac muscle cell.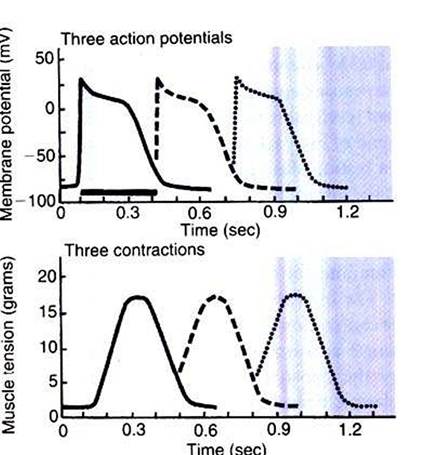
FIGURE 19-6 The first of three cardiac action potentials (solid line, top) causes a cardiac contraction (solid line, bottom). Note that the action potential and contraction have similar durations.The heavy horizontal bar under the first action potential shows the duration of the absolute refractory period. The dashed line and dotted line in the top graph show the earliest possible occurrence of a second and a third action potential, each occurring right after the absolute refractory period for the preceding action potential. The dashed line and dotted line in the bottom graph depict the corresponding cardiac contractions. Because of the long refractory period, each contraction is almost over before the earliest possible next contraction can begin.This guarantees a period of cardiac relaxation between contractions.