Electrodiagnostic Testing
Monica Aleman, Consulting Editor
Neuroelectrodiagnostic medicine is considered an extension of the neurologic examination and comprises several diagnostic techniques for the evaluation of the various components of the nervous, neuromuscular, and muscular systems.1 Electrodiagnostic testing might assist in the identification, and determination of localization and severity of lesions in certain challenging cases.1 Although electrodiagnostics might not provide a definitive diagnosis in every case, it aids in the approach, direction, or support of a clinical diagnosis.2 Depending on the electrodiagnostic technique performed and patient cooperation, some techniques can be done with the patient under intravenous (IV) sedation or general anesthesia.
Examples of techniques that can be performed with the patient under IV sedation include electroencephalography, brainstem auditory evoked response (BAER) testing, visual evoked response (VEP) testing (helpful for the study of central blindness), blink reflex testing, electroretinography (ERG; helpful for the study of blindness due to retinal disease), and electromyography (EMG). Techniques that can be performed with the patient under general anesthesia include sensory and motor nerve conduction studies and repetitive nerve stimulation (RNS).2-10 It is preferable for single-fiber EMG (SF-EMG) to be done with the patient under general anesthesia for more accurate performance and interpretation of results.2 However, this technique has been performed in awake horses.Electroencephalography
Electroencephalography is the recording of spontaneous electrical activity (field potentials) of the cerebral cortex. It is the graphic representation of the voltage difference between two locations within the cerebral cortex plotted over time. This primarily represents synaptic activity: excitatory post- synaptic potentials (EPSP) and inhibitory post-synaptic potentials (IPSP) in cortical neurons, mainly pyramidal cells.
It has been estimated that approximately a minimum of 108 neurons are needed to produce a detectable change in voltage on the electroencephalogram (EEG). However, electrical activity might be modified by deeper structures such as the brainstem, reticular activating system, and thalamus. Thalamic oscillations are transmitted to the cerebral cortex via projection neurons and are thought to be responsible for the slow waves and spindles associated with slow-wave sleep. With regards to electrical activity, ion excitation or inhibition occurs between the intracellular and extracellular spaces when sodium or chloride, respectively, moves intracellularly. The extracellular current is what gives rise to the surface recorded EEG.Electroencephalography is valuable diagnostic technique for the study of paroxysmal activity (e.g., epileptic discharges), sleep and sleep disorders, alterations in behavior, and detecting abnormal activity such as seizure-like episodes, tremors, and myoclonic activity other than seizures.11-14 Along with clinical observations, electroencephalography aids in the refinement of epileptic disorders (e.g., localization and classification of paroxysmal discharges within the cerebral cortex).11 A normal EEG does not rule out the presence of an epileptic disorder; it means only that at the time of recording, abnormal electrical activity was not observed. Alteration in mentation and behavior might be associated with paroxysmal activity, but this is not possible to define unless electroencephalography is performed.15 The effects of antiseizure medication in the patient can also be evaluated through evaluation of the EEG. Similarly, sleep and sleep disorders can be further investigated and classified on the basis of clinical observations, along with evaluation of the EEG.16,17 Sleep deprivation is not a sleep disorder; it is simply lack of sleep, whose various causes include sleep dis- orders.16,17 Other reports about the use of electroencephalography include the assessment of nociception during surgical procedures and studying the effects of various sedatives and anesthetics on the EEG.3,18-25 Electroencephalography has also been used in slaughter facilities to monitor brain activity during captive bolt stunning in cattle.26 The author has used electroencephalography in patient monitoring at the intensive care unit (e.g., for traumatic brain injury, status epilepticus, comatose patients) and euthanasia (i.e., through overdose of intravenous [IV] barbiturates or intrathecal lidocaine during general anesthesia).27,28 Depth of anesthesia has also been studied with EEG power spectrum analysis in horses.19,29
Depending on patient cooperation, goals of the study, and disease process, the EEG can be obtained with the patient in standing sedation or general anesthesia.
However, it is recommended that electroencephalography in a horse be performed when the horse is not anesthetized because of the effects of drugs and anesthetics on EEGs.17 Examples of alterations in the EEG include suppression of electroencephalographic activity by anesthetics, transient paroxysmal discharges, and the lack of observation of all states of vigilance. The major disadvantage of performing electroencephalography in a sedated horse is movement artifacts. However, interpretable recordings are possible. Furthermore, the states of vigilance can be evaluated only in a nonanesthetized animal. States of vigilance in the horse as determined through electroencephalography consist of wakefulness, drowsiness, slow-wave sleep, and rapid eye movement (REM) sleep.17 Automated quantification of electroencephalographic activity in animals have been used. However, a disadvantage of quantitative electroencephalography is that artifacts might be included in the analysis of data, which results in misleading clinical interpretation.While the EEG is recorded, electro-oculography, electrocardiography, and respiratory monitoring are concurrently performed to distinguish electrical activity by other structures
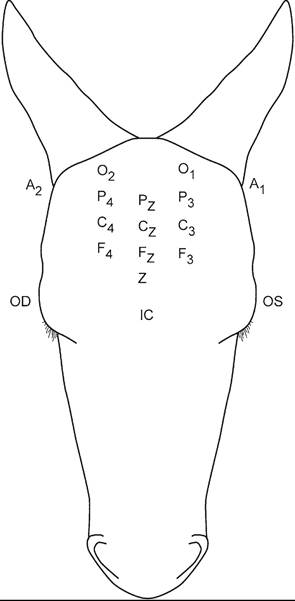
FIG. 35.3 Electrode placement in electroencephalography. Even numbers represent the right side; odd numbers represent the left side; A, aural; C, central; F, frontal; FP, frontopolar; IC, intercanthus; O, occipital; OD, right eye; OS, left eye; P, parietal; Z, ground; subscript z, midline. From Aleman M, Gray LC, Williams DC, et al. Juvenile idiopathic epilepsy in Egyptian Arabian foals: 22 cases (1985-2005). J Vet Intern Med 2006;20:1443-1449.
or movement.17 Furthermore, concurrent performance of electroencephalography, electrocardiography, and respiratory monitoring could be very useful and in some cases diagnostic for the investigation of causes of collapse (e.g., distinguishing syncope from seizures).
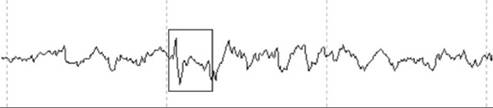
The author also performs concurrent video recording to further investigate the effects of movement on the EEG in the standing sedated horse.3,17 Electrode nomenclature and placement are based on a modified human 10-20 system and described in horses previously.17,30 Two EEG montages have been described in the literature: bipolar and referential.17 Electrode placement can be rostral to caudal or transverse in a bipolar montage (Fig. 35.3). Needle or surface electrodes are commonly used in veterinary medicine. If surface electrodes are used, the skin in the area of the recording has to be shaved and cleaned for better contact. In contrast, needle electrodes can be placed subcutaneously in the scalp without additional preparation.17 The author's institution has a protocol for EEG recording, and areas to record include the prefrontal (two electrodes), frontal (three), central (three), parietal (three) and occipital (two) regions (see Fig. 35.3). Concurrently, electro-oculography (two subcutaneous electrodes per eye, one each in the upper and lower eyelids), electromyography (two subcutaneous electrodes in the splenius muscle), and electrocardiography (one subcutaneous electrode in the region of the left-sided heart base and one at the left-sided heart apex) are also performed.17,30 An additional electrode needs to be placed as the ground (between the two prefrontal electrodes). The author usually records for 30 minutes to 1 hour, except in sleep studies, in which case the electrodes are glued to the scalp and recording lasts several hours.The recorded frequencies are confined to a relatively low range (0.5 to 50 Hz), most being below 30 Hz. Waveform frequencies are 0 to less than 4 Hz (delta waves), 4 to less than 8 Hz (theta waves), 8 to less than 13 Hz (alpha waves), 13 to less than 30 Hz (beta waves), and 30 Hz or more (gamma waves; Fig. 35.4). Electroencephalography produces a low- voltage signal: The recorded amplitude varies from a few to several hundred microvolts, usually less than 100 μV In contrast, the electrocardiogram is recorded in millivolts (Fig.
35.5). Epileptic discharges are depicted as distinct paroxysmal EEG waveforms that are strongly associated with seizures. Common types include spikes (200 ms; Fig. 35.6). These discharges can be observed as single or multiple discharges.Study of sleep in animals has been based mainly on observation. However, to further understand normal sleep and its
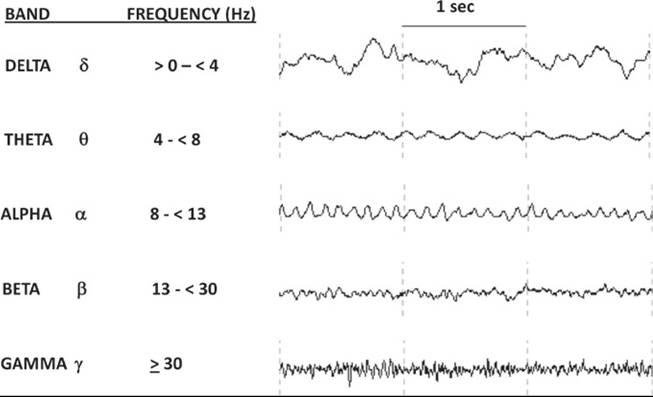
FIG. 35.4 Frequency band definitions and waveforms. (Figure belongs to the Clinical Neuroelectrophysiology Laboratory at the University of California, Davis.)
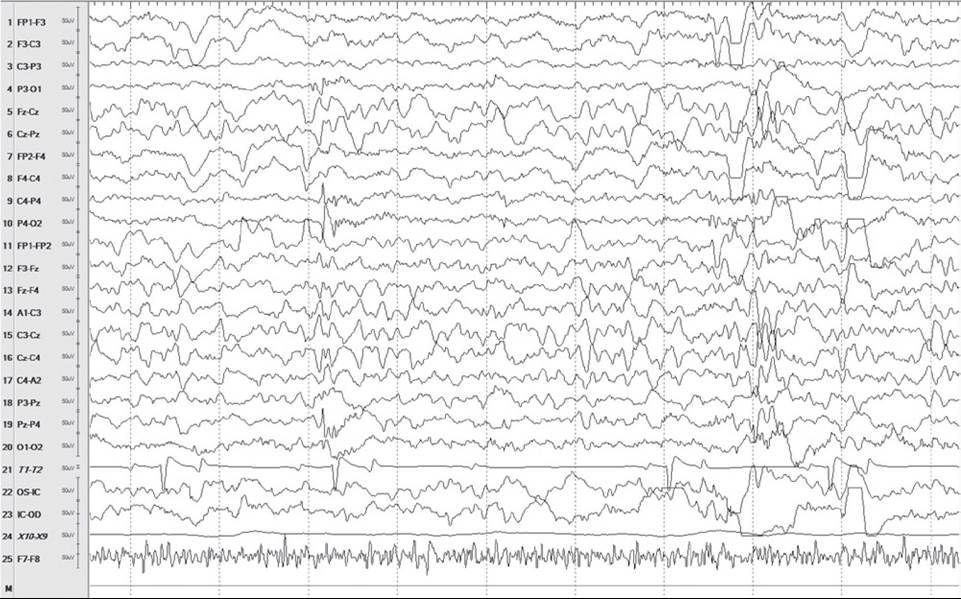
FIG. 35.5 Electroencephalogram (EEG; 10 seconds) showing all areas of recording. For this figure, channels T1 and T2 recorded the electrocardiogram (ECG), X10 to X9 recorded respirations, and F7 to F8 recorded the electromyogram. Each horizontal line represents 1 second, even numbers represent the right side, odd numbers represent the left side, and subscript z represents the midline. Note scale on left in microvolts and difference between the EEG and ECG. Also note atrioventricular block in a horse in slow-wave sleep. A, Aural; C, central; F frontal; FP, frontopolar; IC, intercanthus; O, occipital; OD, right eye; OS, left eye; P parietal; Z, ground.
1 sec
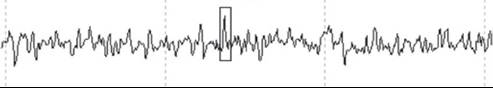
SPIKE (ms)
SPIKE AND WAVE (>200 ms)
FIG. 35.6 Paroxysmal electrical activity: spike, sharp wave, and spike and wave patterns.
variants, as well as abnormal sleep, EEG recording for several hours a day is important.16 A few indoor studies in some species (e.g., horses) have allowed the staging of phases of vigilance.16 However, those stages might not represent natural sleep. In wakefulness, fast electroencephalographic activity is observed; however, the transition from wakefulness to drowsiness is not as defined as in humans.
In the transition stage, intermittent rhythmic 4-Hz background activity is observed on the EEG.17 During this period, horses are usually standing. Variants of sleep can occur during this period. Other normal transient events (sleep spindles and K complexes) have been recorded on EEGs from horses and can be used to identify sleep (equivalent to light sleep in humans).17 The gradual appearance of high-amplitude delta activity, signifying a deeper plane of sleep (human slow-wave sleep [stages 3 and 4]), is similar between species. In horses, the equivalents to stages 2 to 4 of humans can be collectively referred to as slow-wave sleep. Slow-wave sleep can occur while the horse is standing or recumbent. REM sleep in horses has a pattern similar to that in other species: low voltage and mixed frequencies with episodic fast eye movements and loss of EMG activity.17 This stage of sleep constitutes approximately 15% of the total sleep time in horses. This stage cannot occur in the standing horse, otherwise the horse would collapse from lack of muscle tone.16 Horses lie down in lateral recumbency or, if in sternal recumbency, theysupport their heads on the ground or an object.Auditory Evoked Responses
These consist of the study of early latencies (0 to 10 ms) such as BAER, middle latency (10 to 80 ms), late latency (80 to 250 ms), and long latency (>250 ms).
Brainstem Auditory Evoked Response
BAER testing is performed to evaluate the integrity of the auditory pathway from its peripheral (cochlear nerve) to central (brainstem) components.31 It is useful in the detection of complete, partial, unilateral or bilateral auditory loss and in the differentiation between conductive and sensorineural auditory loss.31 In animal species, five distinct waveforms are recognized and represent specific areas in the auditory pathway: the cochlear nerve (wave I), the cochlear nucleus in the medulla (wave II), the olivary nucleus in the medulla (wave III), the lateral lemniscus at the pons (wave IV), and the
■ TABLE 35.2
Brainstem Auditory Evoked Responses (BAER): Possible Causes of Wave Prolongation
| Prolonged Wave | Possible Causes |
| I | External ear disease Middle ear disease Cochlear disease Temporohyoid osteoarthropathy Aminoglycosides |
| I-V Interval | Brainstem disease |
| I-III Interval | Caudal brainstem disease |
| III-V Interval | Rostral brainstem disease |
| V/I Ratio | If and provides information about the electrical activity of contracting muscle (electromyography during activity) provoked by the examiner (e.g., making the horse move its limbs or neck, bear more weight on one limb) or of voluntary movement, and possible risks of anesthesia are avoided. The study during controlled or sustained voluntary muscle contraction is routinely performed in awake human patients but not possible in veterinary medi- cine.47 Depending on the muscles tested and duration of the study, the examiner may use short- or long-acting sedatives (xylazine hydrochloride, 0.3 to 0.4 mg/kg IV, or detomidine hydrochloride, 0.005 to 0.01 mg/kg IV, respectively).2 It is important that the area of the muscles to be studied is clean because a needle will be inserted into the muscle and redirected multiple times. The area should be cleaned or washed if necessary. If the area appears clean, the author usually wipes the area with alcohol gauzes until no dirt is visible. Risks associated with electromyography are uncommon or rare and might include infection at the needle insertion site and inadvertent probing of a nerve or nerve terminal. Mild local discomfort might be experienced at the insertion site. Both insertional and spontaneous EMG activity can be recorded. Insertional activity is the activity related to mechanical stimulation of muscle fibers upon insertion of the electrode into the muscle being tested. This activity should not last more than 1 to 2 seconds in normal animals.39 Insertional activities that are absent, decreased (low amplitude), increased (high amplitude), or prolonged (long duration) are abnormal. Normal spontaneous activity may be found at the end plate or motor unit region.39 Spontaneous normal activity includes miniature end plate potentials, end plate spikes, and motor unit action potential (MUAP).38 The morphologic features (phases, peaks, turns), duration, and amplitude of each MUAP are important for determining abnormality and whether it might be myopathic or neurogenic; for example, giant MUAPs are 3848 observed in neurogenic disease.38,48 Spontaneous activity with neuromuscular disease includes fibrillation potentials, positive sharp waves, complex repetitive discharges, myotonic discharges, and neuromyotonic discharges.',,4°, In acute neuropathic disorders, abnormalities might not be evident on the EMG immediately.39 It might take approximately 2 weeks to detect alterations in the EMG.47 Nerve Conduction Velocity Studies Nerve conduction velocity (NCV) studies are performed to evaluate multiple parameters (e.g., amplitude, latency, velocity) of motor and sensory evoked responses to stimulation of nerves (see Table 35.3).52 To study motor nerve conduction, a nerve must be stimulated during recording from a muscle innervated by that nerve.2 To study sensory nerve conduction a mixed nerve must be stimulated during recording from a cutaneous nerve.52 NCV studies aid in the localization of nerve, neuromuscular junction, and muscle disease. Furthermore, they help distinguish between axonal degeneration and demyelination.52 NCV studies of the facial, radial, median, ulnar, lateral and medial palmar and plantar, sural, and superficial and deep peroneal nerves have been reported in horses and ponies.6,53-61 These studies should be performed with the animal under general anesthesia for safety reasons, for patient cooperation, to prevent pain in the patient, and to obtain interpretable recordings. Most toxic neuropathies have symmetric clinical manifestations and are predominantly sensory.62 Acute lead poisoning can cause motor neuropathy, and chronic lead poisoning can cause both sensory and motor neuropathy.62 Repetitive Nerve Stimulation Repetitive nerve stimulation (RNS) is one of the most useful diagnostic techniques for the study of neuromuscular disease (see Table 35.3).63 A compound muscle action potential (CMAP) or M wave reflects the number of muscle fibers activated by a train of stimuli (repetitive stimulation) applied to a single nerve. The test result is considered abnormal if the number muscle fibers activated during repetitive stimulation (usually 10 consecutive stimuli) decreases.63 This is called a decremental response and is observed in cases of myasthenia gravis.64 The opposite, an incremental response of the M waves in its amplitude and area under the curve (more muscle fibers activated), is observed in cases of botulism.5 Single-Fiber Electromyography This is a selective EMG study for the study of junctionopathies by allowing the measurement of neuromuscular transmission of single end plates (see Table 35.3).65 The MUAPs from a single motor unit are recorded over a small area with a concentric EMG electrode. Variations in myofiber end plate potential amplitude and firing threshold result in variations in latency of subsequent action potentials during nerve stimulation.64 This phenomenon, termed neuromuscular jitter, is increased in diseases in which neuromuscular transmission is disturbed.63,64 This technique has been scarcely used in veterinary medicine.66-68
More on the topic Electrodiagnostic Testing:
-
Veterinarian -
|