Six Standardized Electrocardiographic Leads Are Used in Veterinary Medicine
Figure 20-6 shows actual ECG records obtained from a normal dog. To obtain these recordings, electrodes were placed on the left forelimb, right forelimb, and left hind limb. Electrodes on these limbs are usually envisioned as forming a triangle around the heart (just as electrodes at points A, B, and C form a triangle around the heart in Figure 20-3).
The various ECG tracings in Figure 20-6 were obtained by interconnecting these electrodes in standardized combinations prescribed by Willem Einthoven, inventor of the ECG. As shown in Figure 20-6, B, the voltage in the left forelimb compared with the right forelimb is called lead I. Note that lead 1 corresponds to the voltage measurements discussed with Figure 20-4. The same pattern of distinct P, R, and T waves is evident in the lead 1 tracing in Figure 20-6, as seen in Figure 20-4 (although the T wave is negative in Figure 20-6).In accordance with Einthovens convention, the connections for the three standard limb leads are depicted in Figure 20-6 in the form of a triangle (Einthovens triangle). The triangle indicates that to make a lead I ECG, the voltage is recorded in the left forelimb (labeled the “+” electrode) compared with the right forelimb (called (he electrode). Similarly, the diagram indicates that lead II is the voltage measured in the left hind limb compared with the right forelimb, and lead III is defined as the voltage in the left hind limb compared with the left forelimb. It is important to remember that the + and - signs on Einthoven s triangle are simply notations about how to hook up the electrodes. They indicate, for example, that lead I is obtained by measuring the voltage in the left forelimb compared with the right forelimb (not vice versa). The + and - signs on the triangle do not necessarily correspond to the orientation of the dipoles created in the heart.
As illustrated in Figure 20-6, A, the major ECG events (P, R, and T waves) are normally evident no matter whether one is looking at tracings from leads I, II, or III. These standard limb leads simply provide different “angles” for viewing the electrical dipoles created by the heart as it depolarizes and repolarizes. Three additional electrical “views” are provided by the augmented unipolar limb leads (aVR, aVL, and aVF). Lead aVκ measures the voltage from the right forelimb electrode compared with the average voltage from the other two limb electrodes. Similarly, aV∣ and aVr. measure the voltages from the left forelimb and left hind limb electrodes compared with the average voltage from the other two electrodes.
Leads 1, II, and IH are used routinely in veterinary electrocardiography. Recordings from the augmented unipolar limb leads (aVl, aVk, and aV∣ ) are often included as well. Special additional leads are sometimes recorded by placing ECG electrodes at standardized sites on the thorax. These precordial (chest) leads are used more often in human medicine than in veterinary medicine. They are helpful in evaluation of very specific cardiac electrical dysfunctions.
The standardized vertical calibration on an ECG is that two major divisions equal 1 millivolt (mV). Two standard chart speeds are used: 25 millimeters per second (mm∕sec), whereby five major divisions on the horizontal (time) axis equal 1 second, or 50 mm∕sec, whereby 10 major divisions on the
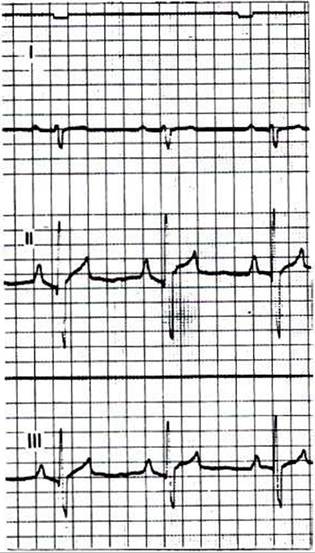
FIGURE 20-7 ECG from a dog with right ventricular hypertrophy.The chart speed is 50 mm/second; therefore, 10 major grid divisions on the horizontal axis equal 1 second. One-second timing marks are visible as small, downward deflections at the very top. Both the PP and the RR intervals are 0.6 second, so both atrial and ventricular rates are 100 per minute.The salient abnormalities are (1) predominantly negative QRS complexes recorded from lead I and (2) large-amplitude, bidirectional QRS complexes recorded from leads Il and III. (From Ettinger SJ: Textbook of veterinary internal medicine, ed 3, Philadelphia, 1989, Saunders.)
horizontal axis equal 1 second. Using the faster chart speed (50 mm∕sec) helps to spread out the ECG events in an animal with a rapid heart rate (e.g., a cat).