The Electrocardiogram Reveals the Timing of Electrical Events in the Heart
Because the predominant waves in an ECG correspond to specific electrical events in the heart, the time between these waves can be measured to determine the timing of events in the heart.
Figure 20-5 indicates the conventions used to define the important intervals and segments in the ECG. The PR interval corresponds to the time between the start of atrial depolarization and the start of ventricular depolarization. The PR interval is typically about 0.1 second in a resting dog. During this time the cardiac action potential is conducted slowly through the AV node. The duration of the QRS complex corresponds to the time it takes for the ventricles to depolarize, once the cardiac action potential emerges from the AV node and AV bundle. Typically this is less than 0.1 second. The QT interval corresponds to the time from the beginning of ventricular depolarization to the end of ventricular repolarization. This approximates the duration of an action potential in ventricular tissue. Typically the QT interval is about 0.2 second. The time between successive P waves (PP interval) corresponds to the lime between atrial depolarizations (and thus atrial contractions). The PP interval can be used to calculate the number of atrial contractions per minute (the atrial rate), as illustrated in Figure 20-5. Likewise, the time between successive R waves (RR interval) corresponds to the time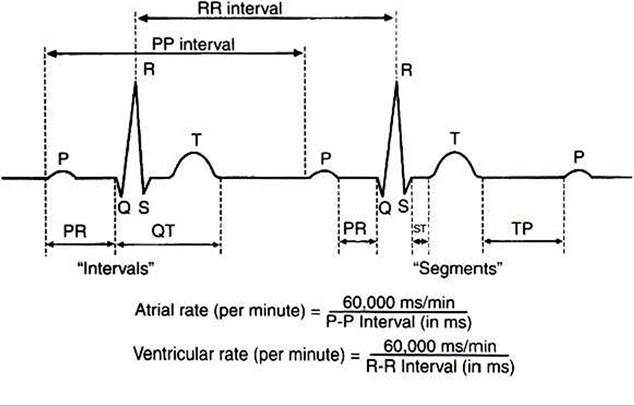
FIGURE 20-5 The time between various waves of the electrocardiogram corresponds to the timing of specific electrical events in the heart. See text for a complete description. The equations show how the atrial rate and the ventricular rate can be calculated from the P-P and R-R intervals, respectively. Of course, in a normally functioning heart, atrial rate = ventricular rate = heart rate.
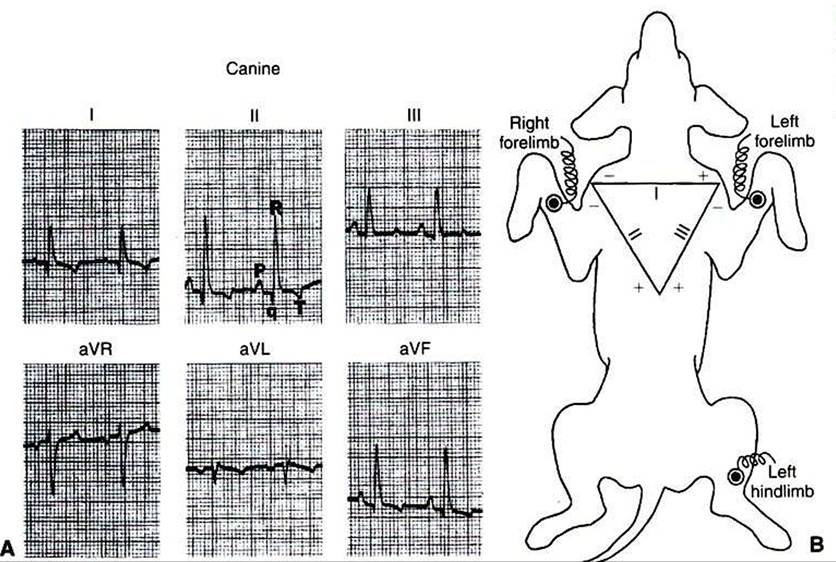
FIGURE 20-6 A, Six-Iead electrocardiogram (ECG) from a normal dog. P, Q, R, andT waves (visible in all six leads) are labeled in lead II. There are no distinct S waves in these ECG recordings, and theT waves happen to be negative in leads I, II, aVL, and aVF.These are not abnormal signs.
B, Einthoven1S triangle depicts the standard conventions for interconnecting the three limb electrodes to obtain lead I, lead II, and lead III ECGs. See text for additional explanation. (FromTiIIey LP: Essentials of canine and feline electrocardiology: interpretation and treatment, ed 2, Philadelphia, 1985, Lea & Febiger.)
between ventricular depolarizations (and thus ventricular contractions), so the RR interval can be used to calculate the ventricular rate. Of course, in a normal heart, the atrial rate equals the ventricular rate.